S&P Monthly Chart Analysis
SPY ETF - S&P 500 - Monthly Time Frame
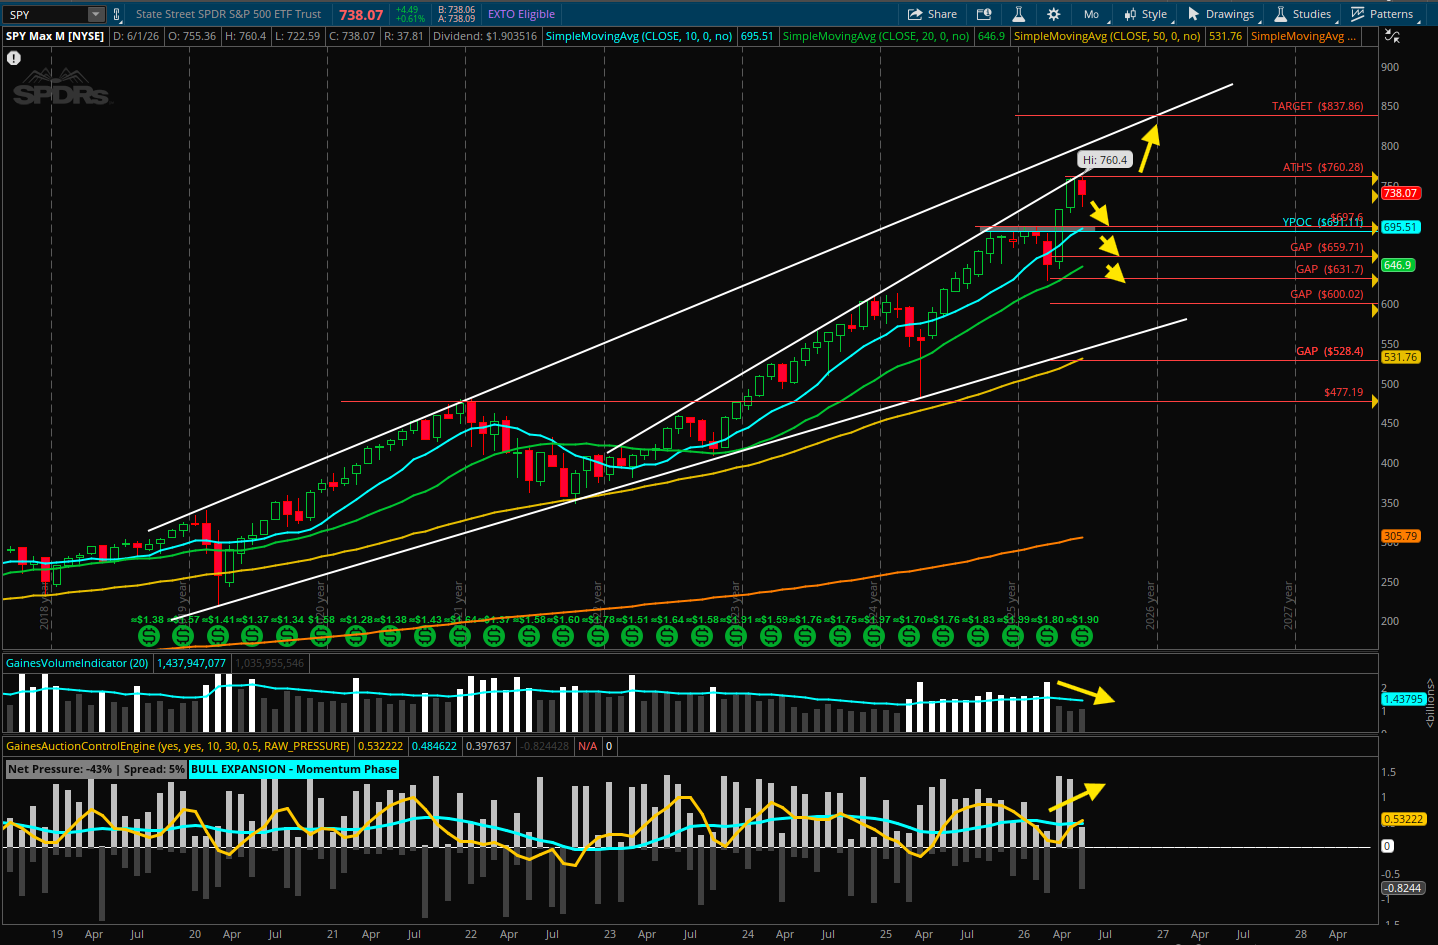
Looking at the monthly chart of SPY, price action appears to be forming a broadening formation, commonly referred to as a megaphone pattern. The index has recently reached the upper boundary of this pattern but has so far failed to establish a new all-time high above 760.28.
Despite this resistance, the longer-term trend remains bullish, as price continues to trade above the 10-month moving average. However, there are signs of potential exhaustion beneath the surface. Since April, volume participation has steadily declined while buying pressure has continued to increase. This divergence between price and volume is noteworthy, as it often precedes periods of consolidation or corrective price action.
If SPY is unable to break decisively above the 760.28 all-time high, the probability of a retest of support near 695 increases. That level represents a critical area of market structure. A breakdown below 695 would likely place several unfilled gaps beneath current price levels into focus, creating potential downside targets for market participants.
Several macroeconomic and geopolitical factors could serve as catalysts for such a move. Ongoing tensions in the Middle East, the Federal Reserve's continued hawkish monetary policy stance, and growing concerns surrounding a potential AI-driven market bubble all have the potential to increase volatility and trigger a broader market correction. Should these risks materialize, the market may seek to rebalance by filling lower gaps and testing deeper support levels.
Disclaimer:
I am not a licensed financial advisor, and the information provided is for educational and informational purposes only. It should not be considered financial, investment, or tax advice. Please consult with a qualified financial professional before making any financial decisions.