
BITCOIN ANALYSIS - $125,200
Bitcoin appears to have formed a potential short-term top near the $125,200 level and is currently consolidating between the 10-week and 20-week moving averages. This range is critical for determining the next directional move. A decisive breakout above the 10-week moving average would indicate renewed bullish momentum, potentially paving the way for a retest of its all-time highs and possibly establishing a higher resistance zone. Conversely, if Bitcoin fails to hold the $109,000 support level, which aligns with the lower end of the current consolidation range, it could trigger a deeper correction toward the psychological $100,000 mark. Traders should monitor volume trends and momentum indicators such as RSI and MACD to confirm any breakout or breakdown scenario
Bitcoin appears to have formed a potential short-term top near the $125,200 level and is currently consolidating between the 10-week and 20-week moving averages. This range is critical for determining the next directional move. A decisive breakout above the 10-week moving average would indicate renewed bullish momentum, potentially paving the way for a retest of its all-time highs and possibly establishing a higher resistance zone. Conversely, if Bitcoin fails to hold the $109,000 support level, which aligns with the lower end of the current consolidation range, it could trigger a deeper correction toward the psychological $100,000 mark. Traders should monitor volume trends and momentum indicators such as RSI and MACD to confirm any breakout or breakdown scenario.
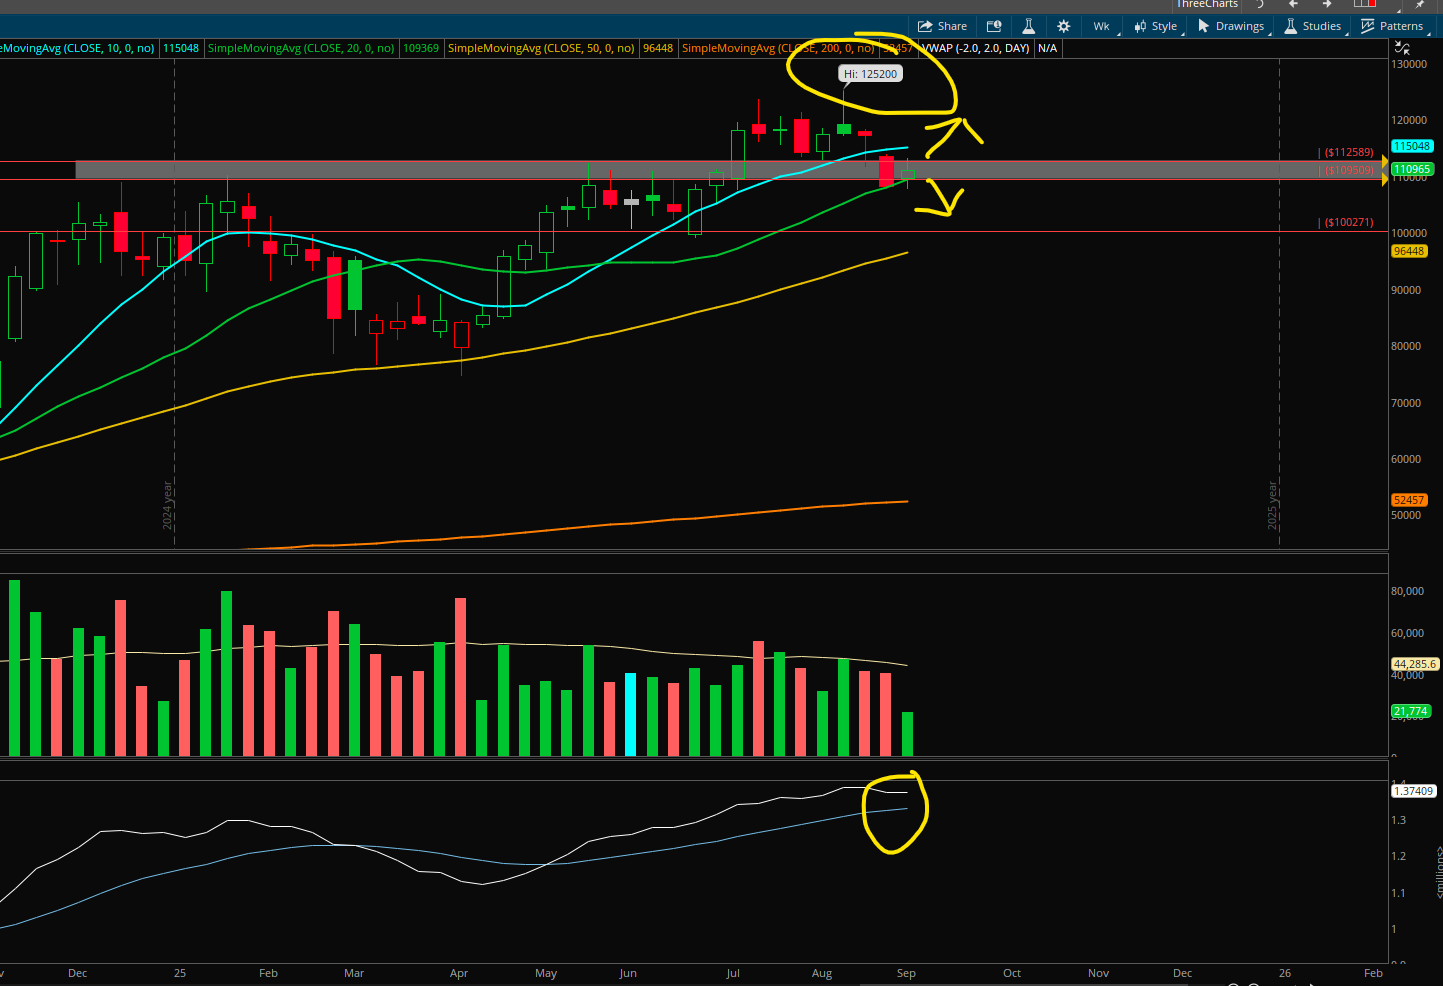
This is a chart of Bitcoin
Disclaimer:
I am not a licensed financial advisor, and the information provided is for educational and informational purposes only. It should not be considered financial, investment, or tax advice. Please consult with a qualified financial professional before making any financial decisions.