
S&P Monthly Chart Analysis
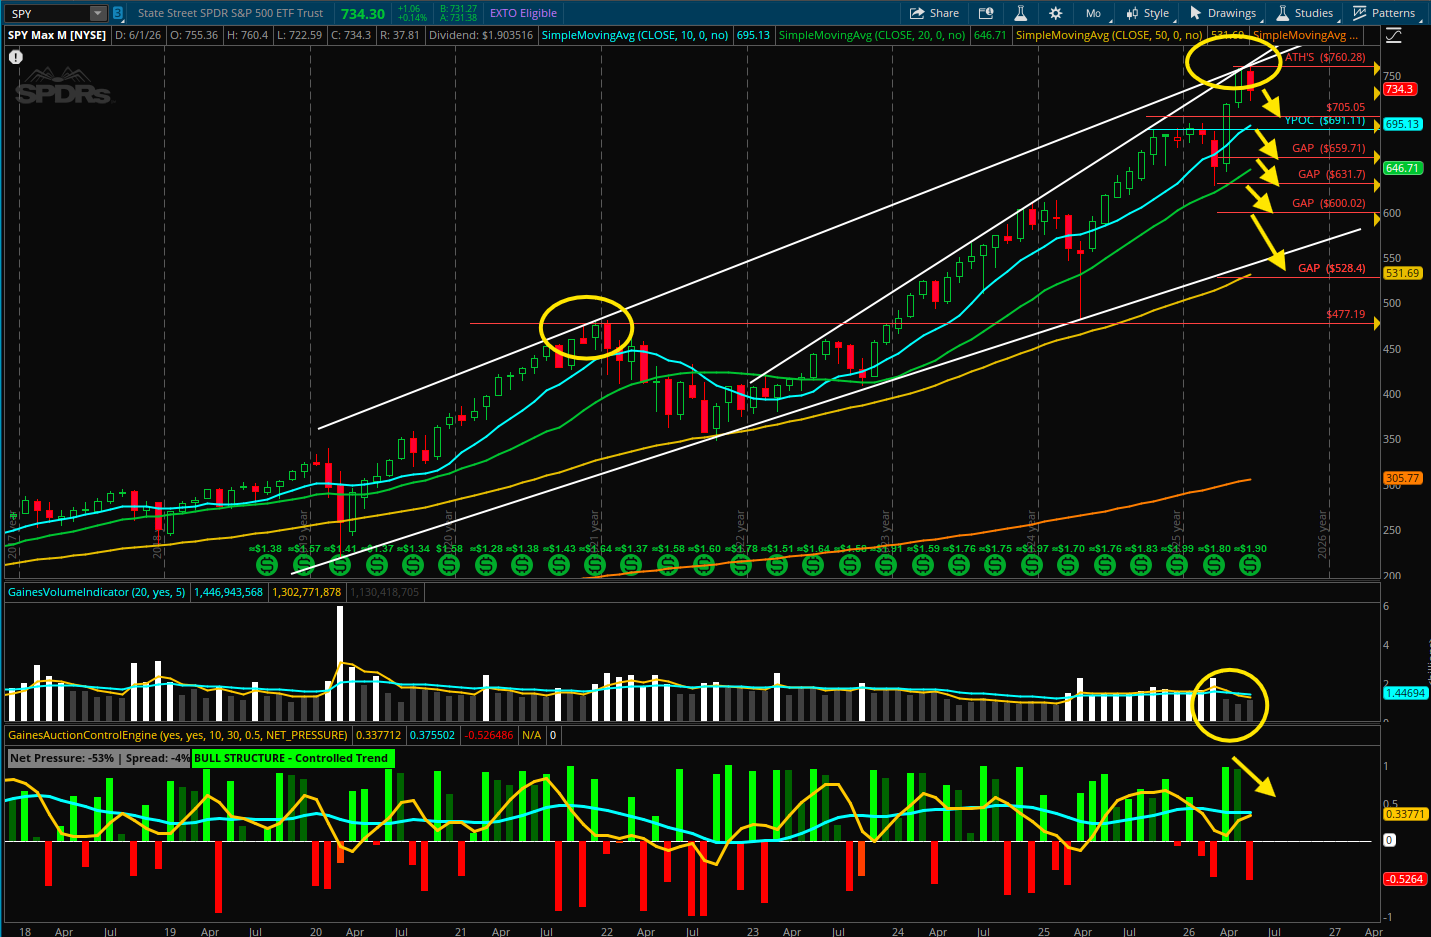
SPY ETF - S&P 500 - Monthly Time Frame
Looking at the monthly time frame, SPY remains well above its 10-month moving average and continues to trade within a long-term bullish channel. However, price is now testing a significant resistance zone. If SPY is unable to break above its current all-time high of 760.28, it could signal a move lower toward the 705–691 support area.
A decisive break below that support zone would increase the probability of filling the unfilled gaps beneath it.
Volume also warrants attention. April and May, despite strong buying pressure and higher prices, were accompanied by declining volume. In contrast, June has so far been characterized primarily by selling pressure, with volume already exceeding May's volume. While June's volume has not yet surpassed April's, the increase in selling volume relative to May suggests that distribution may be developing. If selling pressure continues to build, SPY could decline toward the 705–691 support zone.
Disclaimer:
I am not a licensed financial advisor, and the information provided is for educational and informational purposes only. It should not be considered financial, investment, or tax advice. Please consult with a qualified financial professional before making any financial decisions.

FOMC ANNOUCEMENT 25 Basis Rate Cut - S&P 500 Analysis 9/17/2025
Today, Jerome Powell announced a 25-basis-point rate cut, but markets struggled to interpret the move. Trading closed with a doji candlestick, reflecting indecision, though sellers ultimately held more control.
Today, Jerome Powell announced a 25-basis-point rate cut, but markets struggled to interpret the move. Trading closed with a doji candlestick, reflecting indecision, though sellers ultimately held more control. The uncertainty around how many additional cuts may follow over the next year has raised expectations of heightened volatility, according to Jack McIntyre, portfolio manager at Brandywine Global. Amid the confusion, one concern stood out: the Federal Reserve’s growing unease with the strength of the U.S. labor market. Investors remain torn between optimism over lower borrowing costs and caution surrounding employment weakness.
S&P 500 Chart Analysis
Disclaimer:
I am not a licensed financial advisor, and the information provided is for educational and informational purposes only. It should not be considered financial, investment, or tax advice. Please consult with a qualified financial professional before making any financial decisions.

S&P 500 MARKET UPDATE | FOMC MEETING 9/16/2025
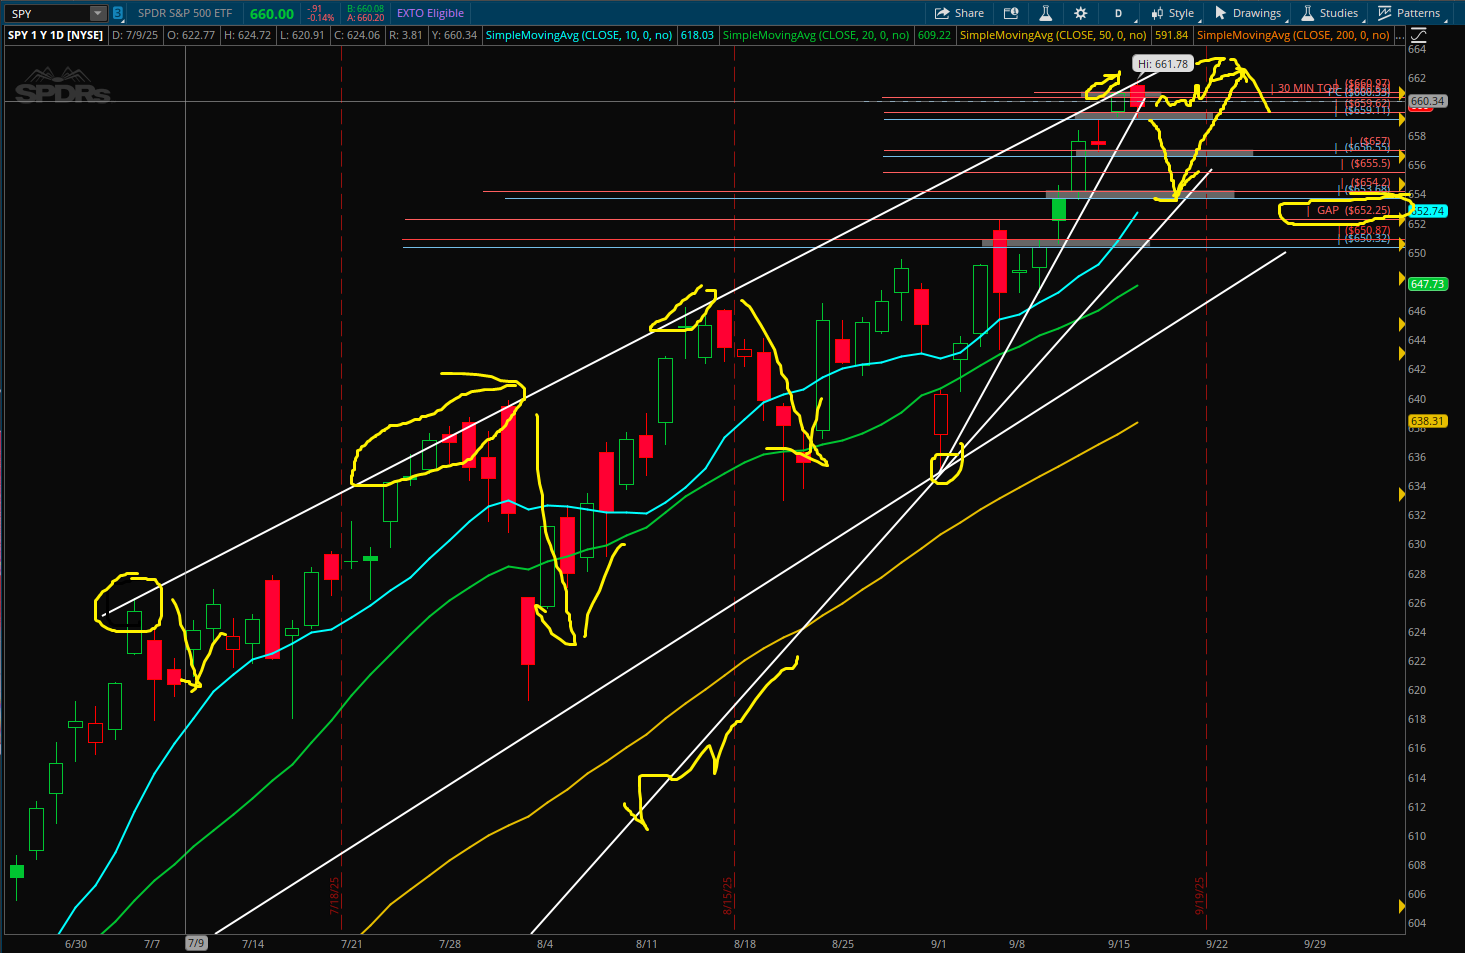
The S&P 500 has continued pushing to new all-time highs this week ahead of tomorrow’s FOMC meeting (9/17). In the background, however, there are signs of caution. The VIX has broken above its 50-day moving average, while BND (the Total Bond Market ETF) has pushed above its 200-week moving average.
The bullish price action in both bonds and the VIX could be a warning signal for equities. If the bears fail to defend the 659 support level, we may see a gap fill down toward 652, which also lines up with a potential retest of the 10-day moving average.
S&P 500 Chart Analysis
Disclaimer:
I am not a licensed financial advisor, and the information provided is for educational and informational purposes only. It should not be considered financial, investment, or tax advice. Please consult with a qualified financial professional before making any financial decisions.

SPY TRADING ANALYSIS 9-11-2025
The Dow Jones, Nasdaq and S&P 500 all made new all-time highs, it appears CPI/PPI data were well received this week by the market. I’m seeing a breakout of a trendline on the S&P 500 that may take us to the 660-area target. We may back test the breakout around the 655 area before continuation.
S&P 500 Trading Analysis

4hr S&P 500 Chart
Disclaimer:
I am not a licensed financial advisor, and the information provided is for educational and informational purposes only. It should not be considered financial, investment, or tax advice. Please consult with a qualified financial professional before making any financial decisions.

SPY Trading Analysis - 9/10/2025
The S&P 500 gapped higher at the open, following yesterday’s breakout and a stronger-than-expected PPI report released at 8:30 a.m. This bullish momentum carried the index to new all-time highs before sellers stepped in, driving prices lower and breaking through both the 652 support level and the uptrend line.
However, the market managed to stabilize and recover some of its losses into the close. Looking ahead, all eyes will be on tomorrow’s CPI data, which could set the tone for the next move. The key question is whether the bulls can regain control and push the index decisively above the 653 resistance level.
S&P 500 Price Action Analysis
Disclaimer:
I am not a licensed financial advisor, and the information provided is for educational and informational purposes only. It should not be considered financial, investment, or tax advice. Please consult with a qualified financial professional before making any financial decisions.

S&P 500 Trading Analysis
Gold, Bitcoin, the VIX, and Bonds have all been on the decline this week, which may signal a risk-on environment—a positive backdrop for equity buyers. The S&P 500 has been consolidating in a range between 647 and 650, but today’s session closed with a slight breakout, suggesting the potential for a push toward 651 and all-time highs. The repeated tests of the 647 level also form a triple bottom, reinforcing bullish sentiment. Attention now shifts to the upcoming PPI and CPI releases, which could play a pivotal role in shaping price action for the rest of the week.
S&P 500 Price Action Analysis on 9/9/2025
Disclaimer:
I am not a licensed financial advisor, and the information provided is for educational and informational purposes only. It should not be considered financial, investment, or tax advice. Please consult with a qualified financial professional before making any financial decisions.

9-4-2025 S&P 500 Trading Session - $126
9/4/2025 Trading Session on the S&P 500.
In today’s trading the session the S&P 500 filled the gap down and so I lost $34 in 646 calls. I quickly switched to 643 0DTE puts and made $27 on the downward movement. At around 10am the market rebounded breaking 646 resistance and closing the gap above at an attempt to hit all-time highs. I’m swinging a 648 call that is currently $133 in profit. I’m expecting the S&P 500 to hit all times on 9/5/2025.


Disclaimer:
I am not a licensed financial advisor, and the information provided is for educational and informational purposes only. It should not be considered financial, investment, or tax advice. Please consult with a qualified financial professional before making any financial decisions.

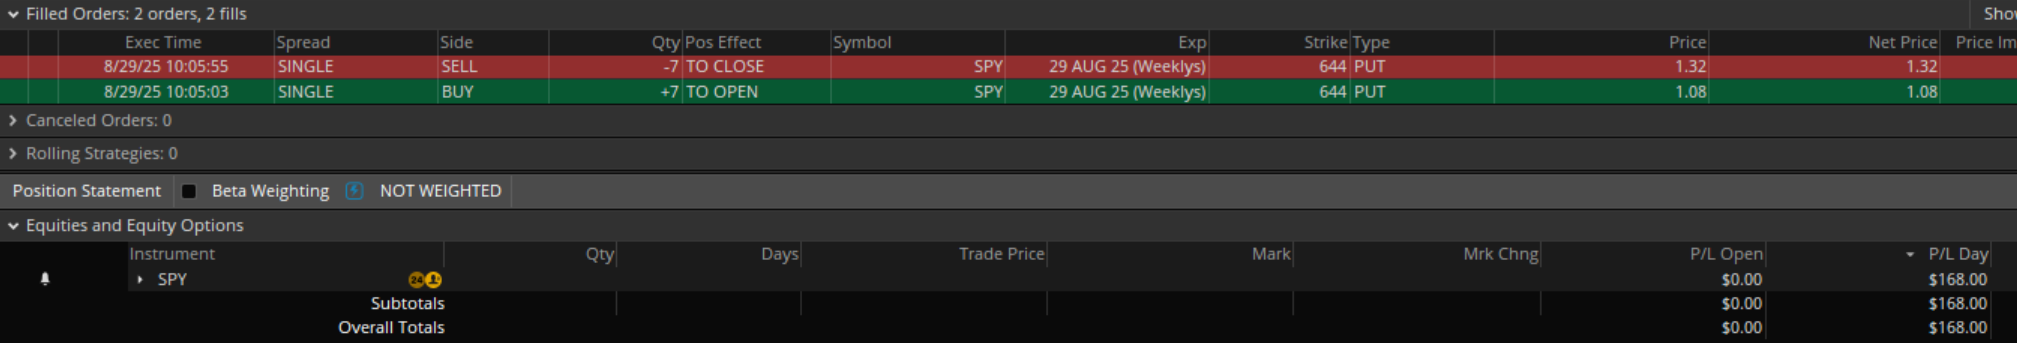
$168 Gain in 60 Seconds | Options Trading
Good morning,
This morning, I saw the S&P 500 gap down and break support at 646. I acted fast and bought seven 644 puts at $108 each and sold them less than a minute later for $132 each. That’s a $168 profit in under 60 seconds.
Sounds exciting, right? Many people I meet want this kind of quick win. But here’s the truth: trading is not investing. It’s high risk, and for every win like this, I’ve experienced plenty of losses.
Strong financial planning isn’t built on short-term speculation. It’s about long-term investing, disciplined strategies, and risk management that protect and grow your wealth. Quick profits can happen, but true financial success comes from a solid plan.
Which side do you want to build your future on—short-term luck or long-term strategy?
Disclaimer:
I am not a licensed financial advisor, and the information provided is for educational and informational purposes only. It should not be considered financial, investment, or tax advice. Please consult with a qualified financial professional before making any financial decisions.