July 2026 Market & Economic Pulse: A Mid-Year Snapshot
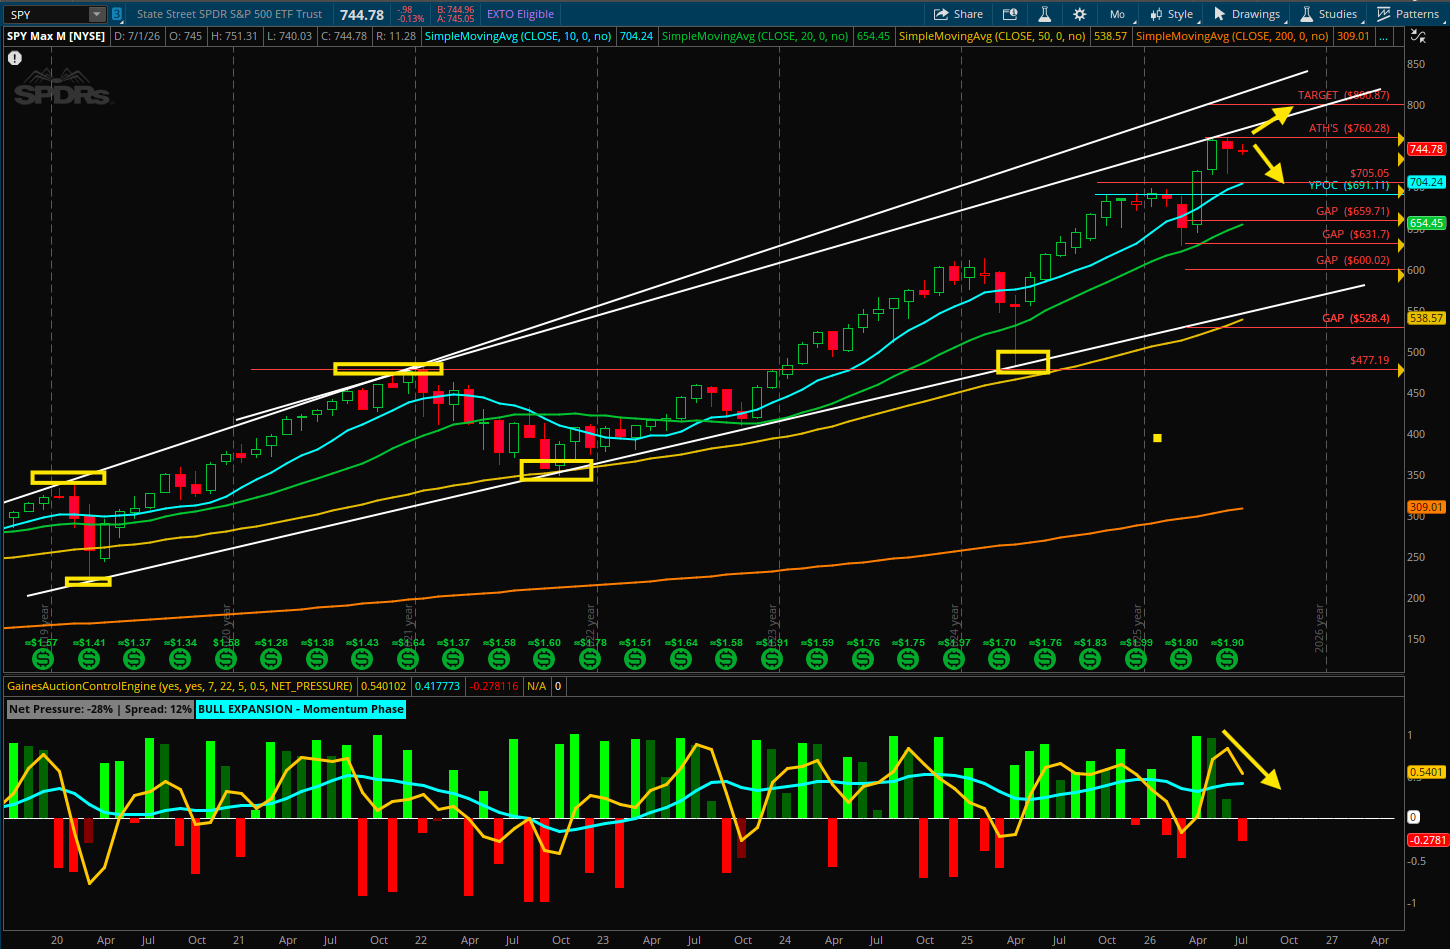
S&P 500 - Monthly Chart
Executive Market Summary
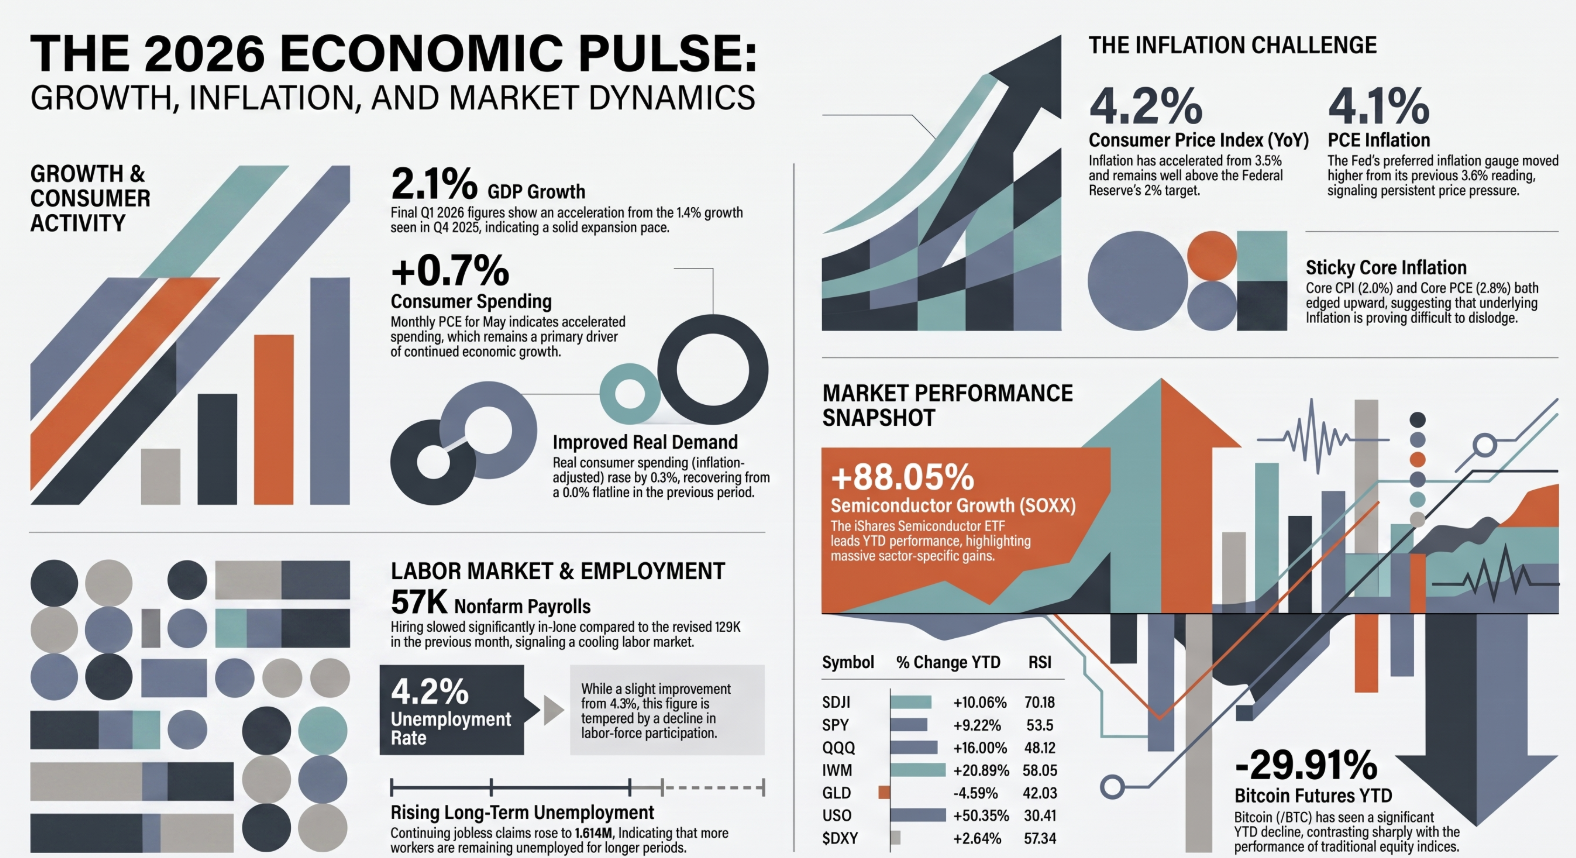
As of July 2, 2026, the U.S. financial markets exhibit a narrative of resilience underscored by significant sector-specific volatility. Year-to-date (YTD) performance for the broader benchmarks remains robust, with the Dow Jones Industrial Average ($DJI) returning +10.06% and the tech-heavy Invesco QQQ posting a +16.00% gain. However, a stark divergence is visible within the technology landscape; the semiconductor sector (SOXX) has achieved a meteoric +88.05% YTD surge, yet it faces immediate-term headwinds, evidenced by a sharp -5.20% daily pullback. This mid-year junction reveals an economy grappling with "sticky" inflation even as the dominant "Magnificent 7" stocks continue to anchor market capitalization through high-growth AI and cloud narratives.
The Macroeconomic Landscape: Growth vs. Inflation
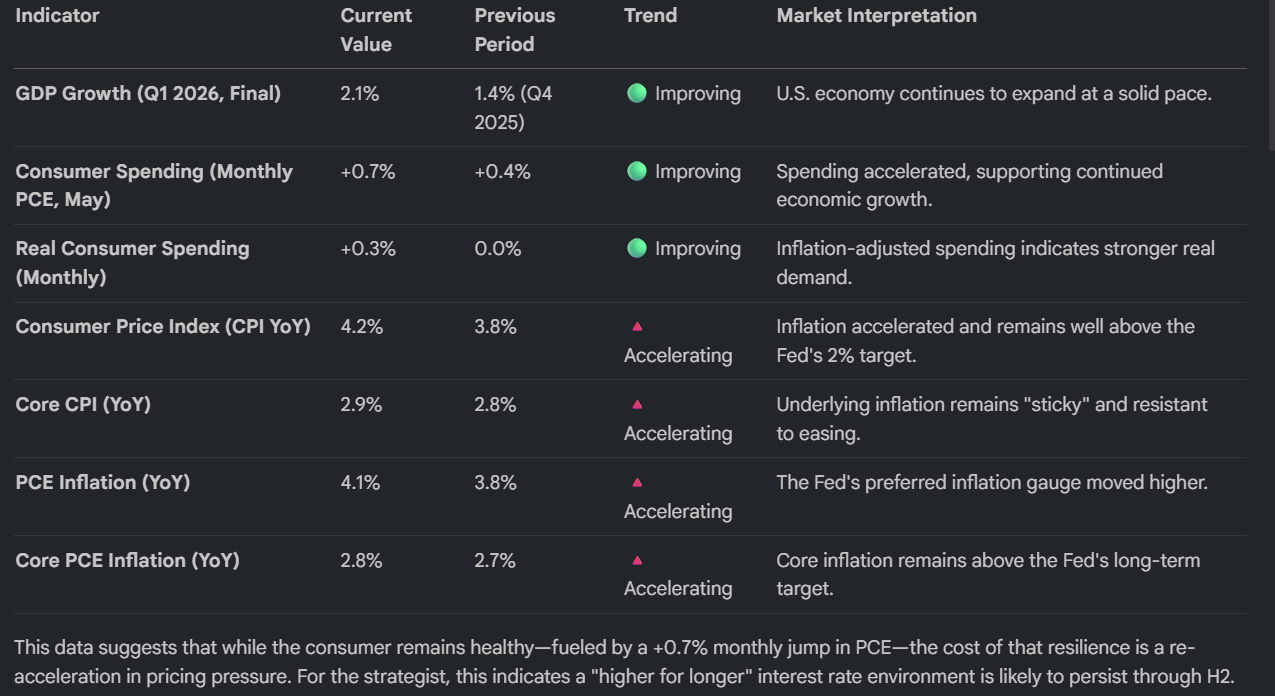
The first half of 2026 has been defined by a fundamental "tug-of-war." Solid top-line growth and accelerating consumer demand are acting as a floor for the economy, while persistent inflationary pressure prevents the Federal Reserve from reaching its 2% target.
Labor Market Trends: Cooling Signals
While headline unemployment remains low, the internal dynamics of the labor market suggest a transition toward "stagnant re-employment."
Labor Force Dynamics
Deceleration in Hiring: June Nonfarm Payrolls arrived at a muted 57K, a significant drop from the revised previous figure of 129K, signaling a clear cooling in employer appetite.
Nuanced Unemployment: The Unemployment Rate sits at 4.2% (a slight improvement from 4.3%), but this headline figure is dampened by a noted decline in labor-force participation.
Stagnant Re-employment: While layoffs remain historically low (Initial Jobless Claims at 215K), Continuing Jobless Claims have climbed to 1.814M. This delta suggests that while workers aren't being terminated in mass, those currently unemployed are finding it increasingly difficult to secure new roles.
Wage Stabilization: Average Hourly Earnings remain steady at 0.3% MoM and 3.5% YoY, providing a moderate but consistent floor for inflation.
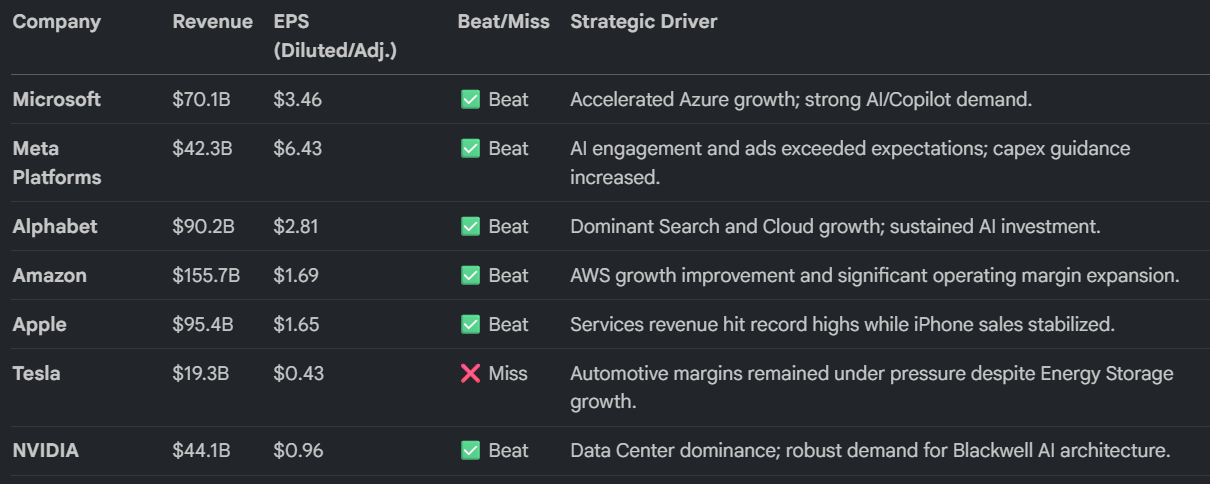
Corporate Earnings Spotlight: The Magnificent 7 (Q1 2026)
The Q1 2026 earnings season reinforced the dominance of AI infrastructure and cloud services. The robust Blackwell AI demand and Azure growth recorded here are the primary fundamental drivers behind the massive +88.05% YTD gain in the semiconductor sector.
Asset Class & Sector Performance Analysis
Market performance through early July illustrates a stark decoupling between traditional energy, small-caps, and the digital asset space.
Market Heatmap (YTD Performance through July 2, 2026)
Commodities:United States Oil (USO) has been the standout performer with a +50.35% YTD surge, contrasted by a -4.59% decline in Gold (GLD) as the "inflation hedge" trade loses luster to cash.
Fixed Income & Currency: A strengthening US Dollar Index ($DXY) at +2.64% YTD continues to weigh on international returns, while the Vanguard Total Bond Market (BND) has struggled, posting a -1.30% YTD return as yields remain elevated.
Equities & Crypto: Risk-on sentiment has favored small-caps, with the Russell 2000 (IWM) gaining +20.89% YTD. Conversely, Bitcoin Futures (/BTC) have faced a "crypto winter" correction, down -29.91% YTD.
Sentiment & Volatility: Current market positioning appears highly optimistic, perhaps even complacent. The Put/Call ratio ($PCALL) stands at 0.685, indicating a bullish-leaning market that may be over-extended. The VIX remains contained at 16.150, despite recent daily volatility in tech.
Conclusion: The Road Ahead for H2 2026

The U.S. economy enters the second half of 2026 on solid footing regarding GDP and consumer demand, yet the path forward is narrow. The primary risk remains the "sticky" 4.2% CPI inflation, which threatens to keep borrowing costs high and further cool the labor market. While the concentrated Roundhill Magnificent Seven ETF (MAGS) has actually dipped slightly (-1.30% YTD), the broader market participation via the SPY (+9.22%) and ITOT (+10.14%) indicates a resilient, diversified rally. Investors should remain wary of the stagnant re-employment trend and the high level of complacency suggested by the current Put/Call ratio as we navigate the remainder of the year.

S&P Monthly Chart Analysis
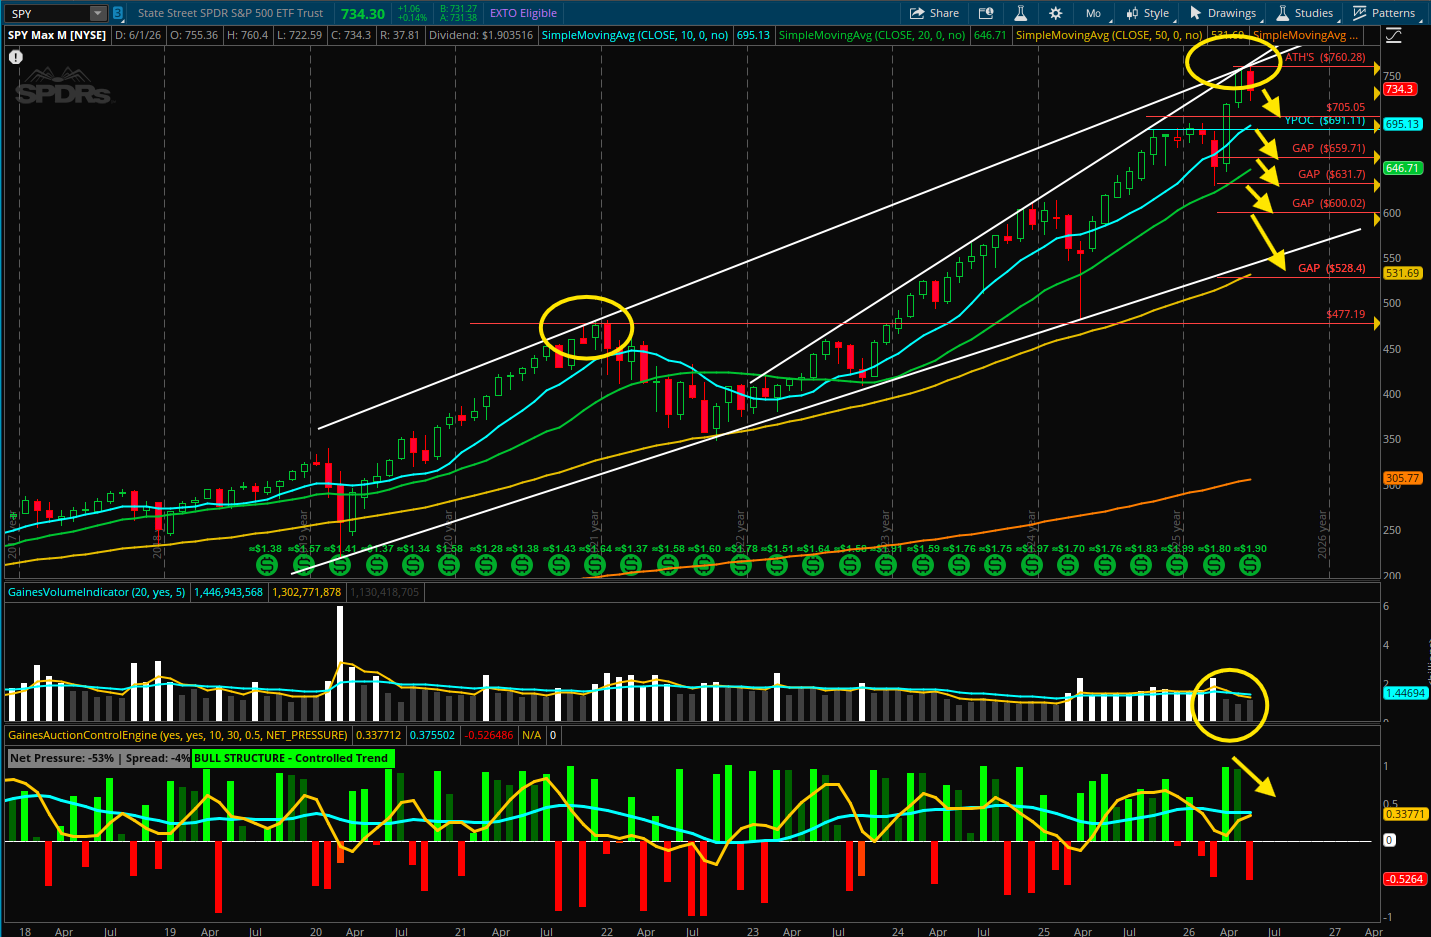
SPY ETF - S&P 500 - Monthly Time Frame
Looking at the monthly time frame, SPY remains well above its 10-month moving average and continues to trade within a long-term bullish channel. However, price is now testing a significant resistance zone. If SPY is unable to break above its current all-time high of 760.28, it could signal a move lower toward the 705–691 support area.
A decisive break below that support zone would increase the probability of filling the unfilled gaps beneath it.
Volume also warrants attention. April and May, despite strong buying pressure and higher prices, were accompanied by declining volume. In contrast, June has so far been characterized primarily by selling pressure, with volume already exceeding May's volume. While June's volume has not yet surpassed April's, the increase in selling volume relative to May suggests that distribution may be developing. If selling pressure continues to build, SPY could decline toward the 705–691 support zone.
Disclaimer:
I am not a licensed financial advisor, and the information provided is for educational and informational purposes only. It should not be considered financial, investment, or tax advice. Please consult with a qualified financial professional before making any financial decisions.
A Strategic Window to Lower Your Mortgage and Unlock Equity
Unlock Your Home’s Potential—And Possibly Secure a Rate Even Lower Than Today’s Market
Right now, the market is presenting a rare opportunity: borrowing costs have come down significantly, while homeowners are still holding strong equity. That combination creates real financial leverage—if you act on it.
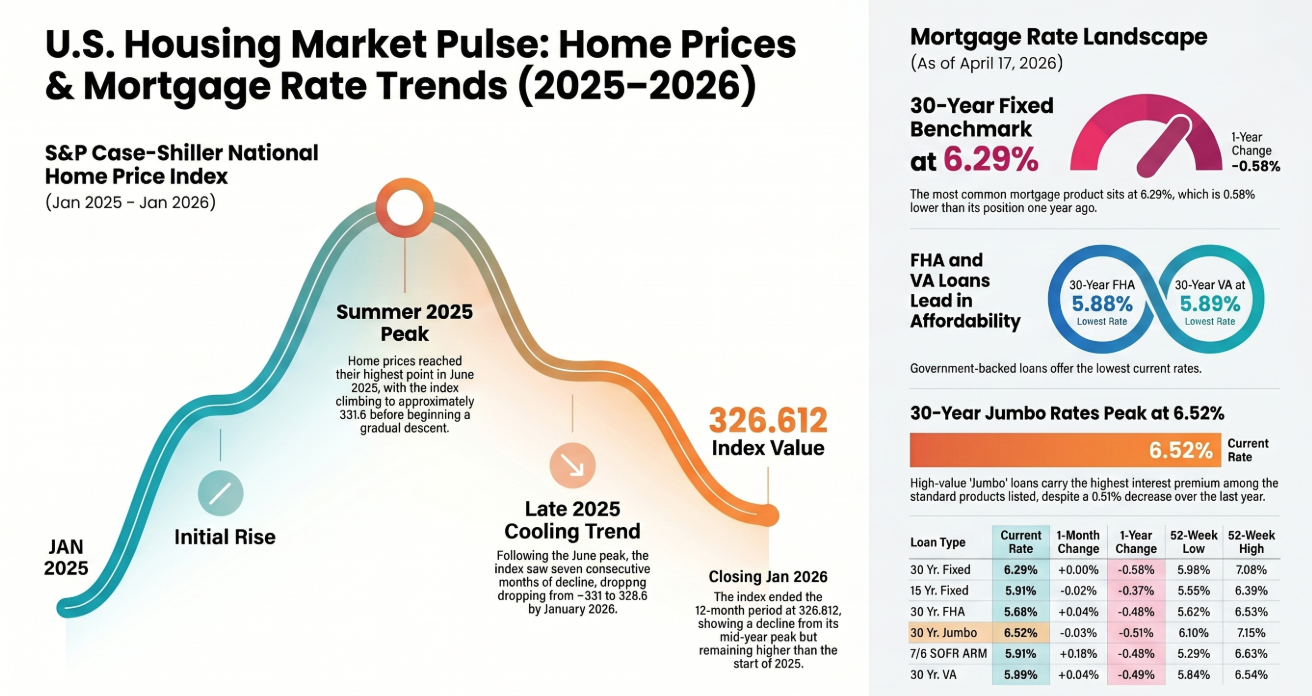
Over the past year, mortgage rates have declined across every major category. The 30-year fixed rate, which peaked above 7%, is now around 6.29%. That shift can translate into meaningful monthly savings and a substantial reduction in long-term interest costs.
But here’s where it gets even more compelling:
Depending on your financial profile, you may qualify for a rate below current market averages.
Through lender partnerships, pricing advantages, and strategic structuring—whether through insured options, shorter terms, or borrower-specific programs—I can often position clients for rates that outperform what’s publicly advertised.
At the same time, home values remain higher than they were a year ago. Even with recent cooling, most homeowners still have solid equity—giving you flexibility to refinance or access cash.
What does that mean for you? It means options:
Lower your monthly payment—potentially more than expected
Consolidate high-interest debt into a simpler, lower-cost solution
Access equity for renovations that increase your home’s value
Put your equity to work through smart investment opportunities
This is a true “sweet spot”:
Rates are down. Equity is intact. And with the right approach, your outcome could be even better than the headlines suggest.
But timing matters.
If rates move back up—or home values soften further—this window could narrow.
The bottom line:
There’s a strong chance you can improve your financial position right now—and possibly secure a better rate than you think.
Let’s take a look at your numbers and see what’s possible.
Your Mortgage Could Be Working Against You

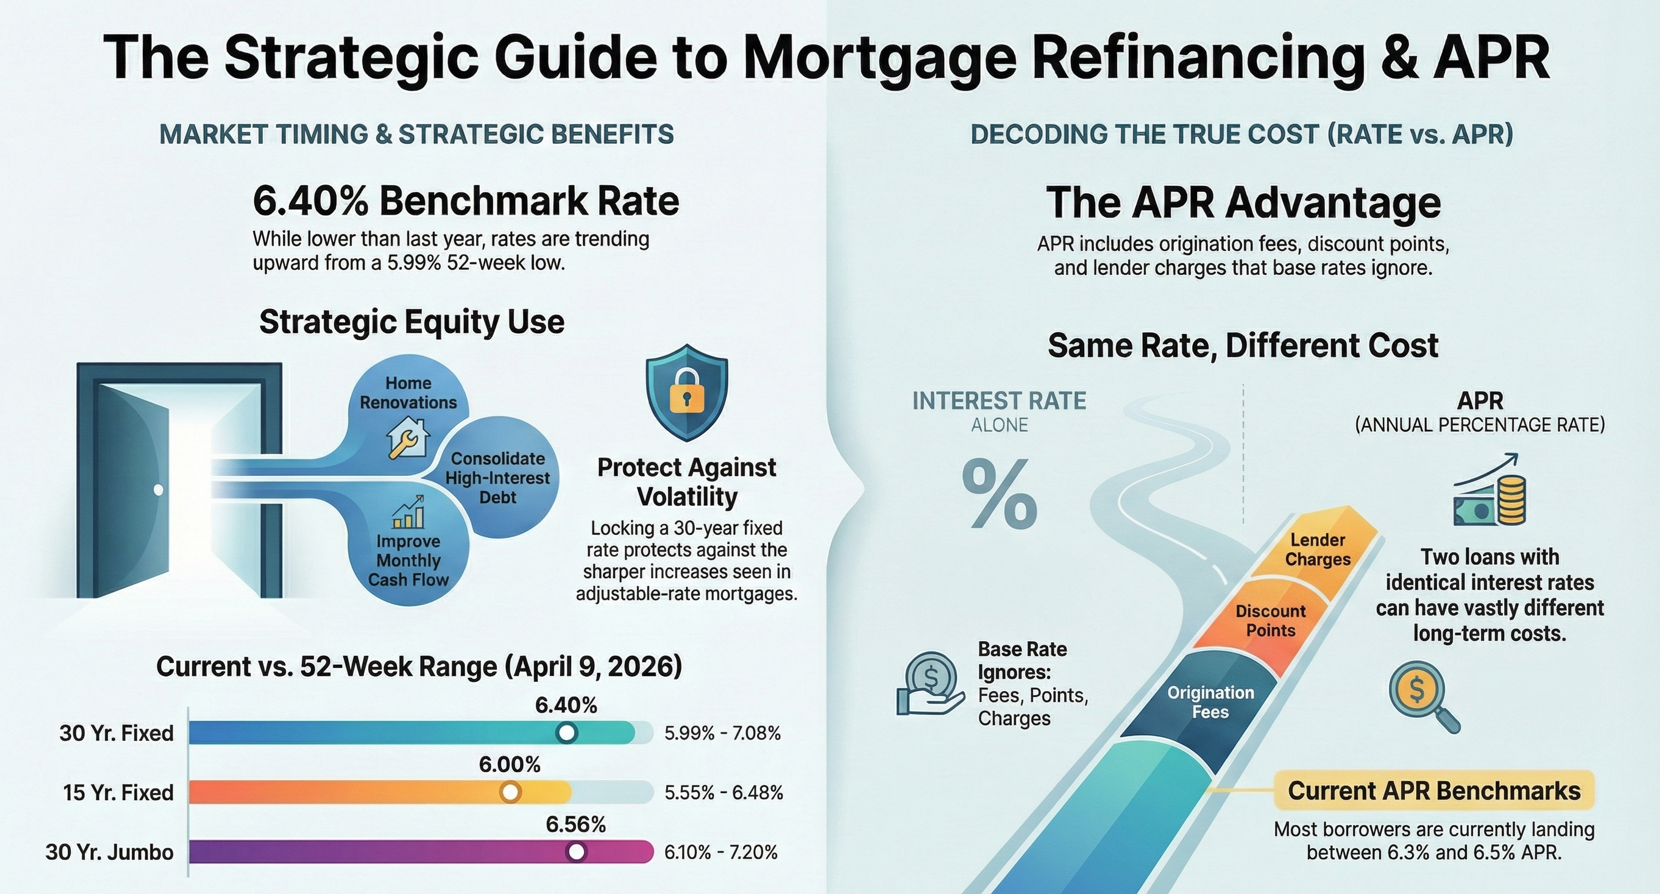
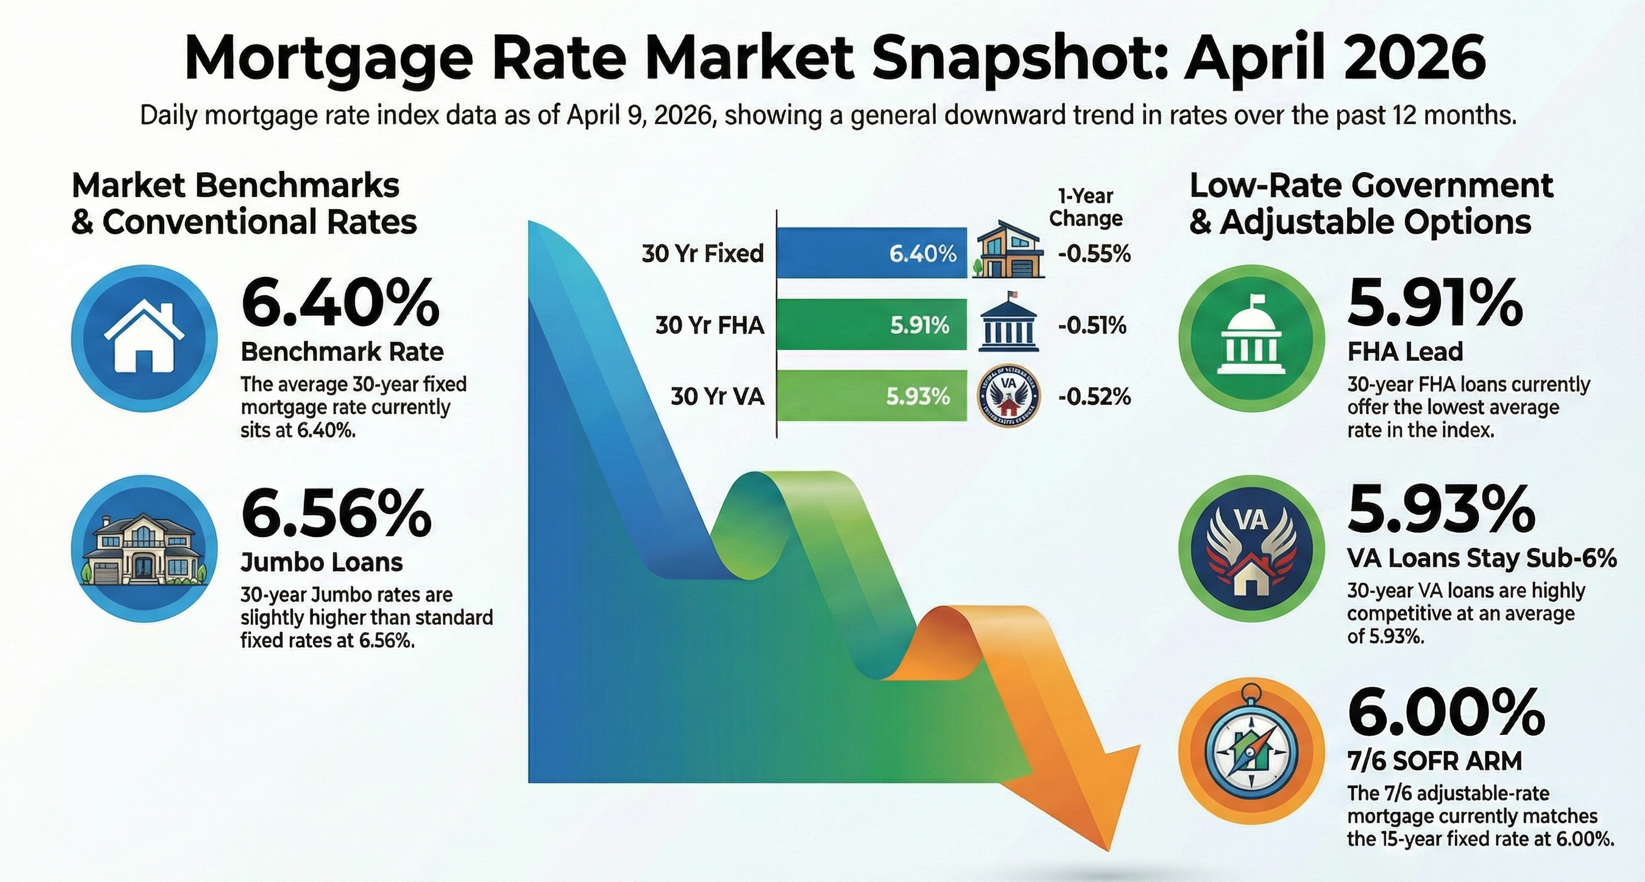
With 30-year fixed rates currently around 6.40%—down from last year but beginning to trend upward—now is an ideal time to consider refinancing. Locking in a stable rate today can protect you from market volatility, especially as adjustable-rate mortgages continue to see sharper increases. But refinancing isn’t just about securing a rate; it can also be a strategic financial tool. You can tap into your home’s equity to fund renovations that may boost your property’s value, consolidate higher-interest debt into a single lower monthly payment, or even extend your loan term to reduce monthly expenses and improve cash flow.
However, it’s important not to be fooled by a seemingly low interest rate. While the rate determines your monthly principal and interest, it doesn’t reflect the full cost of the loan, including origination fees, discount points, and other lender charges. Two loans with the same interest rate can have very different APRs—and very different long-term costs. By focusing on the APR, you see the true cost of the loan, enabling smarter comparisons, avoiding hidden fees, and choosing the option that actually saves you money. Refinancing at the right time, with a clear understanding of both your rate and APR, is a powerful way to strengthen your financial position and gain confidence in your mortgage decisions.
📞 Let’s talk about your options and see how much you could save.
Mortgage Pros is the #1 highest-rated mortgage broker, with a 4.9★ rating and 4,000+ verified reviews (most lenders average around 3★).
Check out our reviews: https://search.google.com/local/reviews?placeid=ChIJ7fFcHF3HJIgRKCOZ2Yrp3fM
The Strategic Advantages of Mortgage Refinancing in Volatile Markets
Why Refinancing Your Mortgage Today Might Actually Be a Winning Move
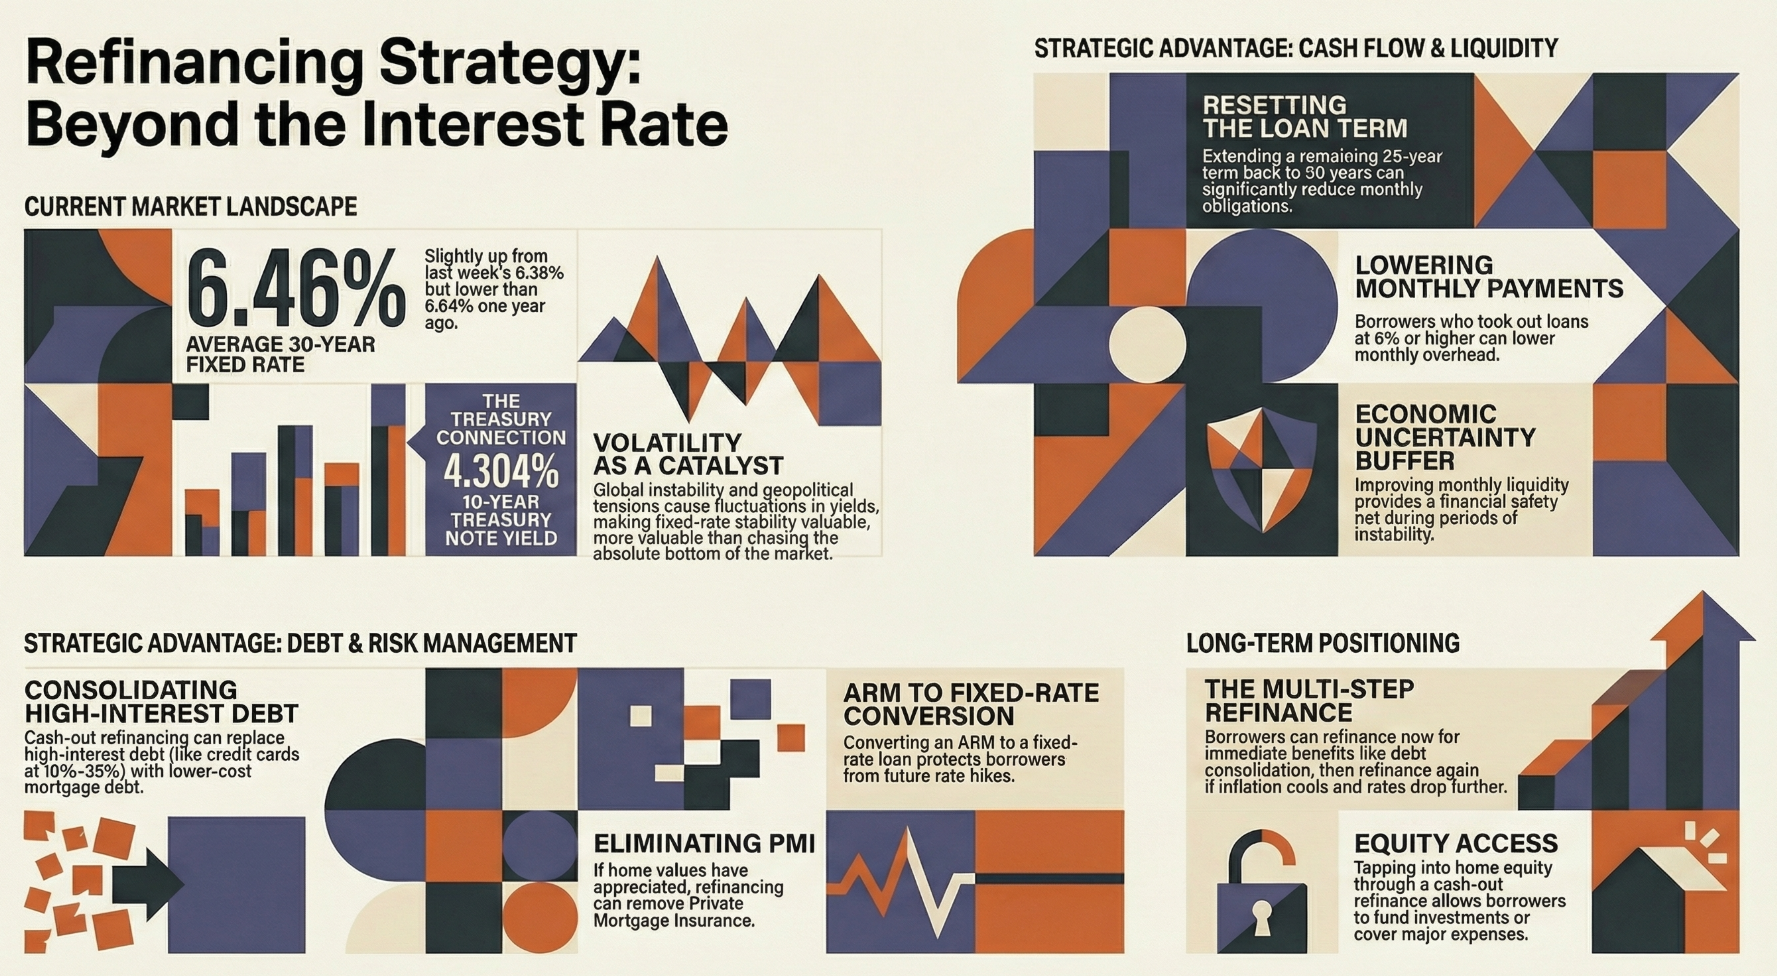
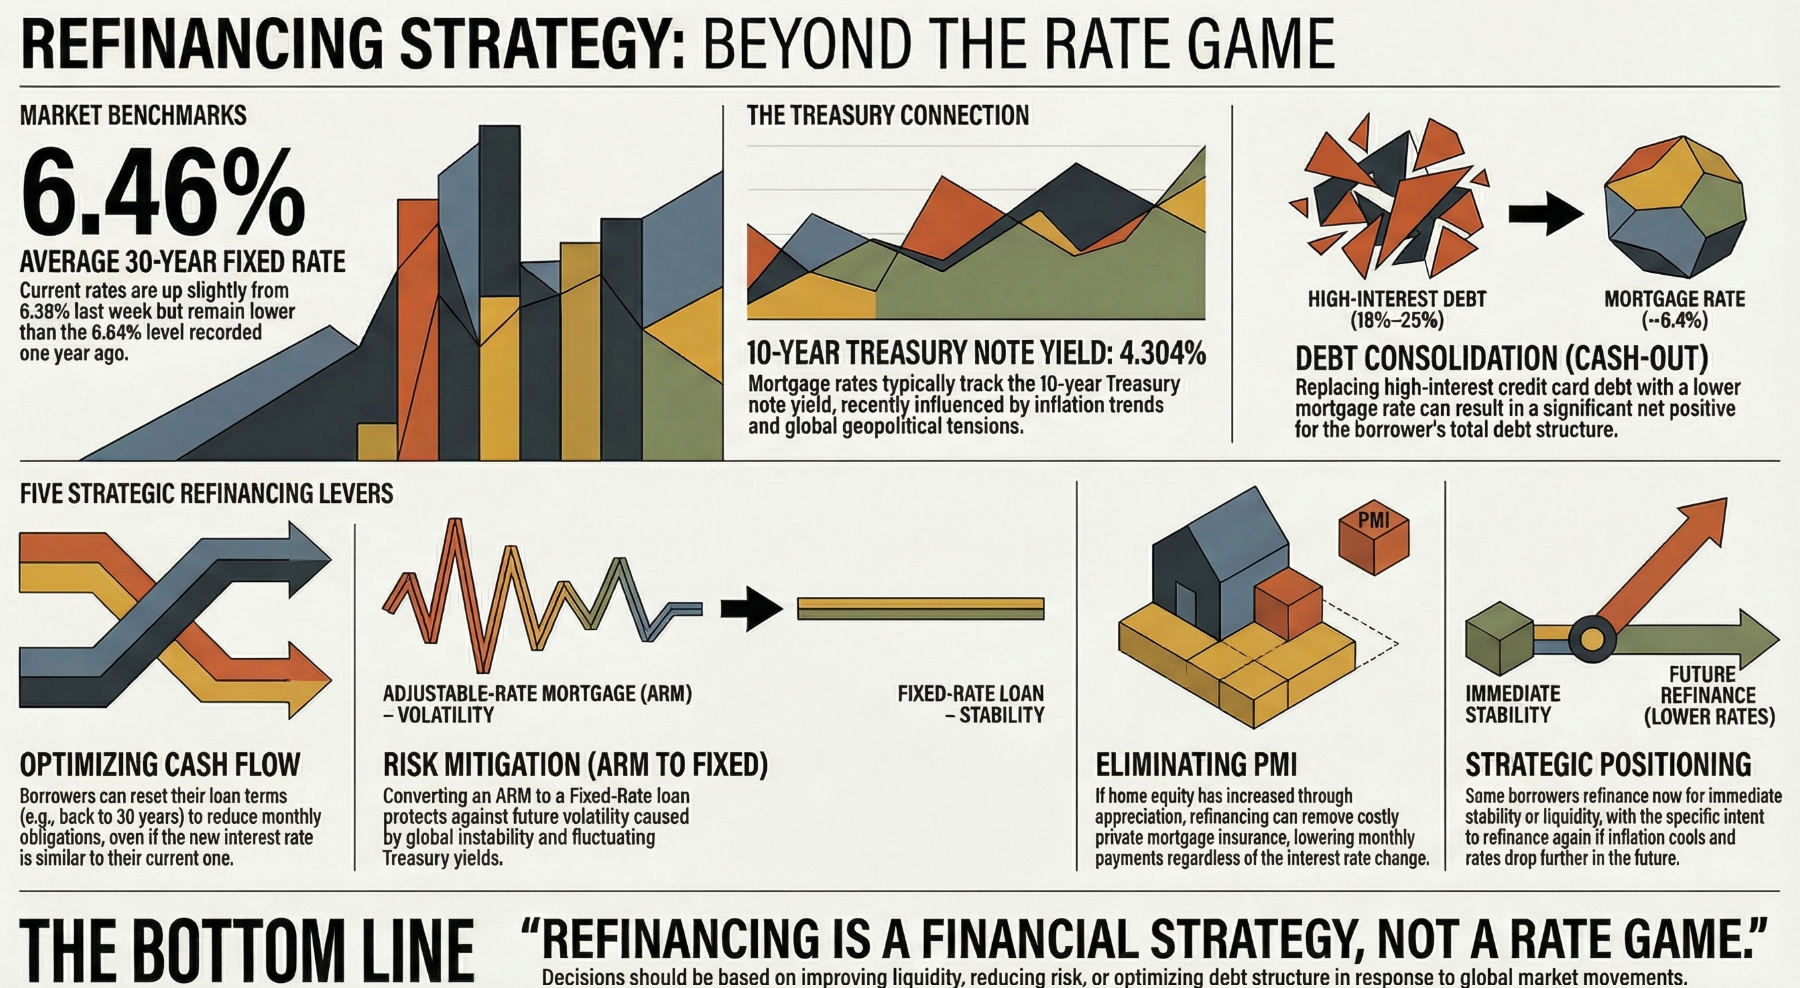
The headline numbers look like a setback, but for the sophisticated borrower, they are a signal to act. Freddie Mac recently reported that the average 30-year fixed-rate mortgage has ticked up to 6.46%. To the casual observer, this upward move from last week’s 6.38% suggests a time to retreat. However, context is everything: today’s 6.46% is still a victory compared to the 6.64% we saw this time last year.
We are currently operating in a "Refinancing Paradox." While the masses wait for the impossible return of 3% rates, the strategic homeowner recognizes that your mortgage is not a static burden—it is a fluid, sophisticated tool for managing liquidity and mitigating risk. In this environment, refinancing is no longer about "chasing the lowest rate"; it is your primary financial shock absorber against a tightening economy.
The Cash Flow Offensive: Resetting the Clock
In a world of economic uncertainty, your greatest asset isn’t just your home—it’s your liquidity. Refinancing serves as a mechanism to restructure your household’s monthly obligations by resetting your loan term. By moving from 25 years remaining back to a fresh 30-year term, you aren’t just extending a debt; you are lowering your immediate monthly overhead.
Cash flow is king. When the world is volatile, a lower monthly bill beats a lower interest rate every time.
This is a critical defensive maneuver. During periods of geopolitical tension, having extra cash on hand provides a necessary safety net. The tactical advantage of having several hundred extra dollars in your pocket every month far outweighs the theoretical "cost" of a slightly higher interest rate over the life of the loan.
Arbitraging Your Way Out of Credit Card Hell
Your home is more than a roof over your head; it is a low-interest credit line that you should be using to optimize your entire balance sheet. We are currently seeing a massive spread between mortgage rates and consumer debt. While a "cash-out" refinance might land at roughly 6.5%, the cost of carrying high-interest credit card debt is a staggering 18% to 25%.
Replacing unsecured, high-cost debt with mortgage debt is a net positive move for your total net worth. You are essentially using your home equity to "buy back" your own debt at a fraction of the cost. As the market reflects:
"Refinancing isn’t just a 'rate game.' In a market influenced by global events and Treasury yield movements, it becomes more of a financial strategy decision."
Locking the Hatch Against Global Volatility
The conflict in the Middle East and ongoing tensions involving Iran have turned the 10-year Treasury yield into a rollercoaster. Because mortgage rates track these yields, anyone currently holding an Adjustable-Rate Mortgage (ARM) is essentially gambling with their largest monthly expense.
Waiting for the "perfect" rate is a dangerous game when global instability can cause yields to spike overnight. Converting from an ARM to a fixed-rate loan now provides a definitive ceiling on your housing costs. Securing a fixed rate today is an act of proactive risk management, protecting your family from future spikes that could be triggered by the next headline out of the Treasury or the Persian Gulf.
Killing PMI with Historic Equity
We have just lived through a period of historic home appreciation. For many borrowers, this surge in equity has created a mathematical "no-brainer": the elimination of Private Mortgage Insurance (PMI).
If your home’s value has climbed enough to put you past the 20% equity mark, refinancing to remove PMI can result in a lower total monthly payment even if the interest rate itself stays flat or increases slightly. When you stop paying an insurance premium that only protects the lender, you effectively give yourself a permanent monthly raise.
The Bridge Strategy: Playing for the Next Drop
The most sophisticated move a borrower can make right now is the "Bridge Strategy." This involves the audacity to refinance today for immediate benefits—like debt consolidation or cash flow—with the explicit intent to refinance again the moment the market shifts.
Refinancing today is a tactical maneuver to survive and optimize the current market while staying "option-rich." If inflation cools and the 10-year Treasury yield continues its descent, you will be in a prime position to strike again. This is a proactive financial stance: you secure your stability now, using today’s rate as a bridge to future opportunities.
Conclusion: Beyond the Interest Rate
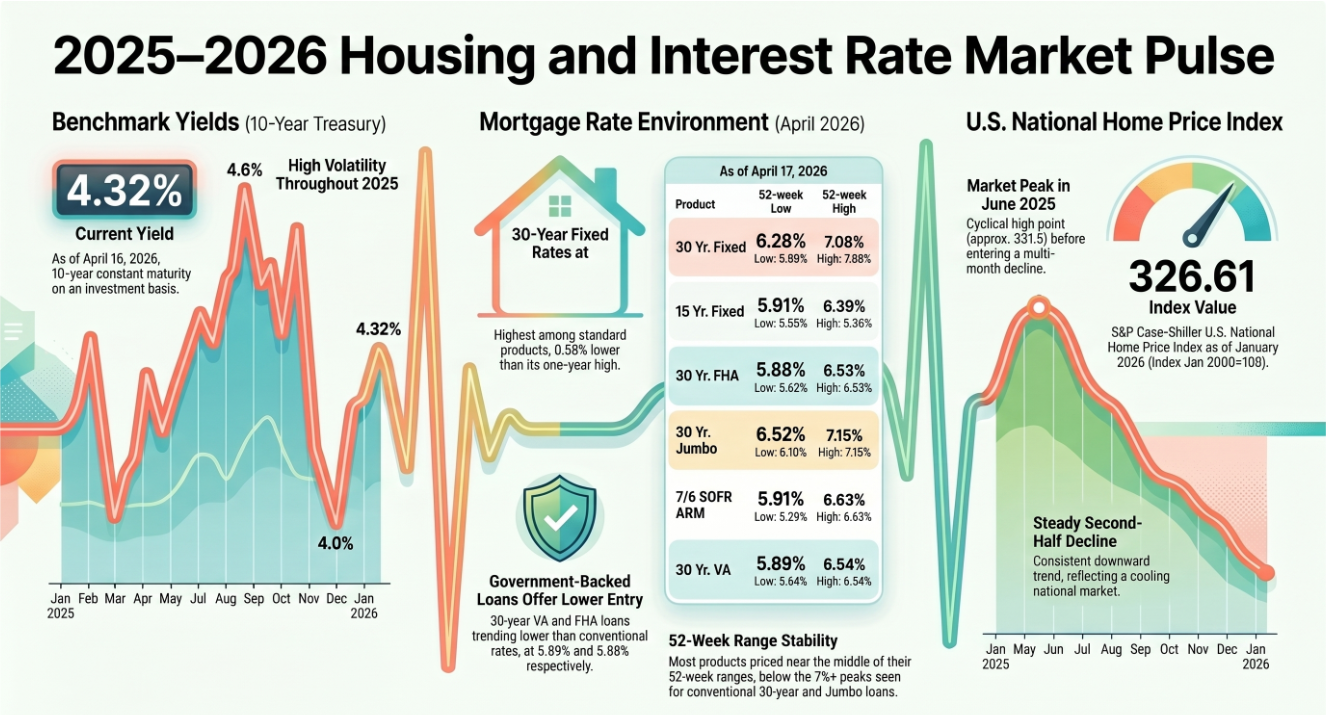
Refinancing is ultimately a tool for optimizing debt structure and insulating yourself from risk. While the 10-year Treasury yield currently sits at 4.304%, it is merely a marker on the map, not the destination. By looking beyond the headline interest rate, you can make decisions that prioritize liquidity, stability, and long-term wealth.
The real question isn't whether the rate is 6.46% or 6.38%. The question is: are you viewing your mortgage as a passive monthly bill, or as the strategic anchor of your total financial health?
April 2026 | Market Pulse

Market Performance and Asset Allocation Briefing
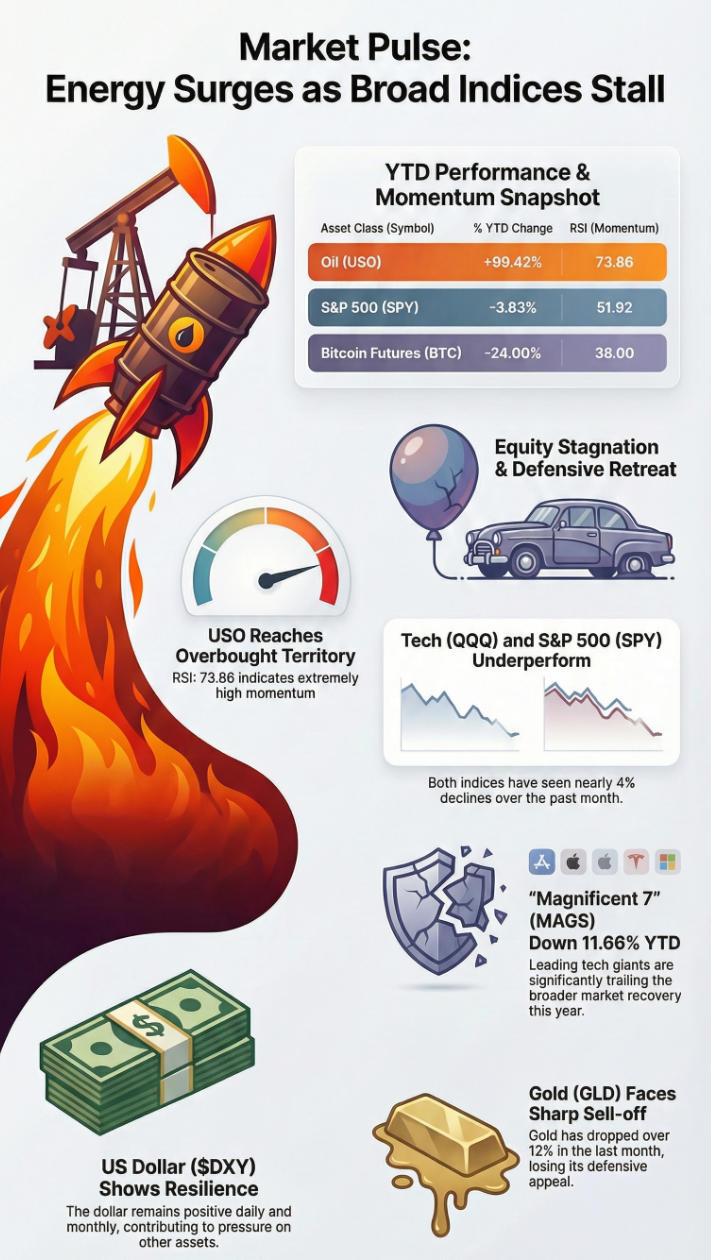
The markets are showing a clear divergence in performance right now. Energy is leading the way, with the United States Oil Fund (USO) nearly doubling YTD, driven by supply constraints and persistent inflation pressures. Meanwhile, major equity indices like the S&P 500 (SPY), Nasdaq 100 (QQQ), and Dow (DIA) are largely flat or down over the past month and year, reflecting a rotation from growth and tech stocks into cyclical and real assets. Volatility remains elevated, with the VIX up about 60% YTD, signaling that risk levels are structurally higher than at the start of the year. The U.S. dollar is consistently strong, tightening global liquidity and putting pressure on commodities, while gold has seen sharp declines, reducing its effectiveness as a safe-haven hedge.
For investors, this suggests a shift in strategy. Overweighting energy and cash or short-duration bonds makes sense, while equities require careful sector selection rather than broad exposure. Traditional hedges like gold are underperforming, and long-duration growth assets are vulnerable to rising yields. Overall, the current environment favors selective, risk-managed allocations, focusing on real assets and strategies that protect against higher volatility and inflation.
Investment Disclaimer: The information provided is for educational and informational purposes only. It should not be considered financial, investment, or tax advice. Please consult with a licensed investment advisor before making any investment decisions.
10 Year Treasury Impact on Financial Products

Chart of the 10-Year Treasury yield
The 10-Year Treasury yield is a cornerstone of financial markets. From 2020 to 2023, yields rose sharply, reflecting inflation concerns and Fed tightening. Since then, yields have mostly plateaued, hovering around 4.1% as of September 2025. Let’s breakdown how the performance of 10 -Year Treasury Yields impacts the following financial products:
1) Index Universal Life Policies (IULs)
High yields → More bond income → Larger options budget → Higher cap & participation rates.
Low yields → Less income → Smaller options budget → Lower caps, possible fee increases.
Client Takeaway:
Higher Treasury yields typically mean better growth potential in IUL policies.
2) Annuities (Fixed, Indexed, MYGAs)
Fixed Annuities & MYGAs:
• Directly tied to bond yields.
• Higher Treasury rates allow insurers to offer more attractive fixed returns.
Indexed Annuities:
• Similar to IULs, they rely on an options budget.
• Higher yields → Improved caps and participation rates.
Variable Annuities:
• Less direct impact, but bond fund performance and guaranteed income riders are influenced by Treasury trends.
Client Takeaway:
Rising yields enhance income potential and flexibility across annuity types
3) High - Yield Savings Accounts (HYSAs)
Bank Benchmarking:
• Banks use Treasury yields to set deposit rates.
• Online banks often respond faster than traditional institutions.
Impact:
• Rising yields → HYSA rates tend to increase (though not always proportionally).
• Falling yields → HYSA rates drop, sometimes rapidly.
Client Takeaway:
HYSA rates are sensitive to Treasury movements, especially in competitive online banking environments.
4) Whole Life Policies
The 10-year Treasury yield is a leading indicator of where whole life dividends are headed.
Insurers may hold bonds for 10–20 years, so changes in the 10-year Treasury yield take years to fully impact dividend scales.
Rising yields → eventual improvement in dividends and cash value growth.
Falling yields → pressure on dividends, slower cash accumulation.
Effects are gradual, not immediate, because of the long-duration bond portfolios insurers hold.

FOMC ANNOUCEMENT 25 Basis Rate Cut - S&P 500 Analysis 9/17/2025
Today, Jerome Powell announced a 25-basis-point rate cut, but markets struggled to interpret the move. Trading closed with a doji candlestick, reflecting indecision, though sellers ultimately held more control.
Today, Jerome Powell announced a 25-basis-point rate cut, but markets struggled to interpret the move. Trading closed with a doji candlestick, reflecting indecision, though sellers ultimately held more control. The uncertainty around how many additional cuts may follow over the next year has raised expectations of heightened volatility, according to Jack McIntyre, portfolio manager at Brandywine Global. Amid the confusion, one concern stood out: the Federal Reserve’s growing unease with the strength of the U.S. labor market. Investors remain torn between optimism over lower borrowing costs and caution surrounding employment weakness.
S&P 500 Chart Analysis
Disclaimer:
I am not a licensed financial advisor, and the information provided is for educational and informational purposes only. It should not be considered financial, investment, or tax advice. Please consult with a qualified financial professional before making any financial decisions.

Debt Reduction Plan - Avalanche Strategy
Below is an example of our debt reduction calculator, designed to help identify the most efficient strategy to pay off debt in the quickest way possible. This approach to debt reduction assumes that a client is able to allocate additional funds each month toward their debt by reviewing and adjusting their budget. Other methods of debt reduction—such as debt consolidation loans, taking out a HELOC (Home Equity Line of Credit), debt settlement, or bankruptcy—are not included in this presentation.
Debt Reduction Calculator

S&P 500 MARKET UPDATE | FOMC MEETING 9/16/2025
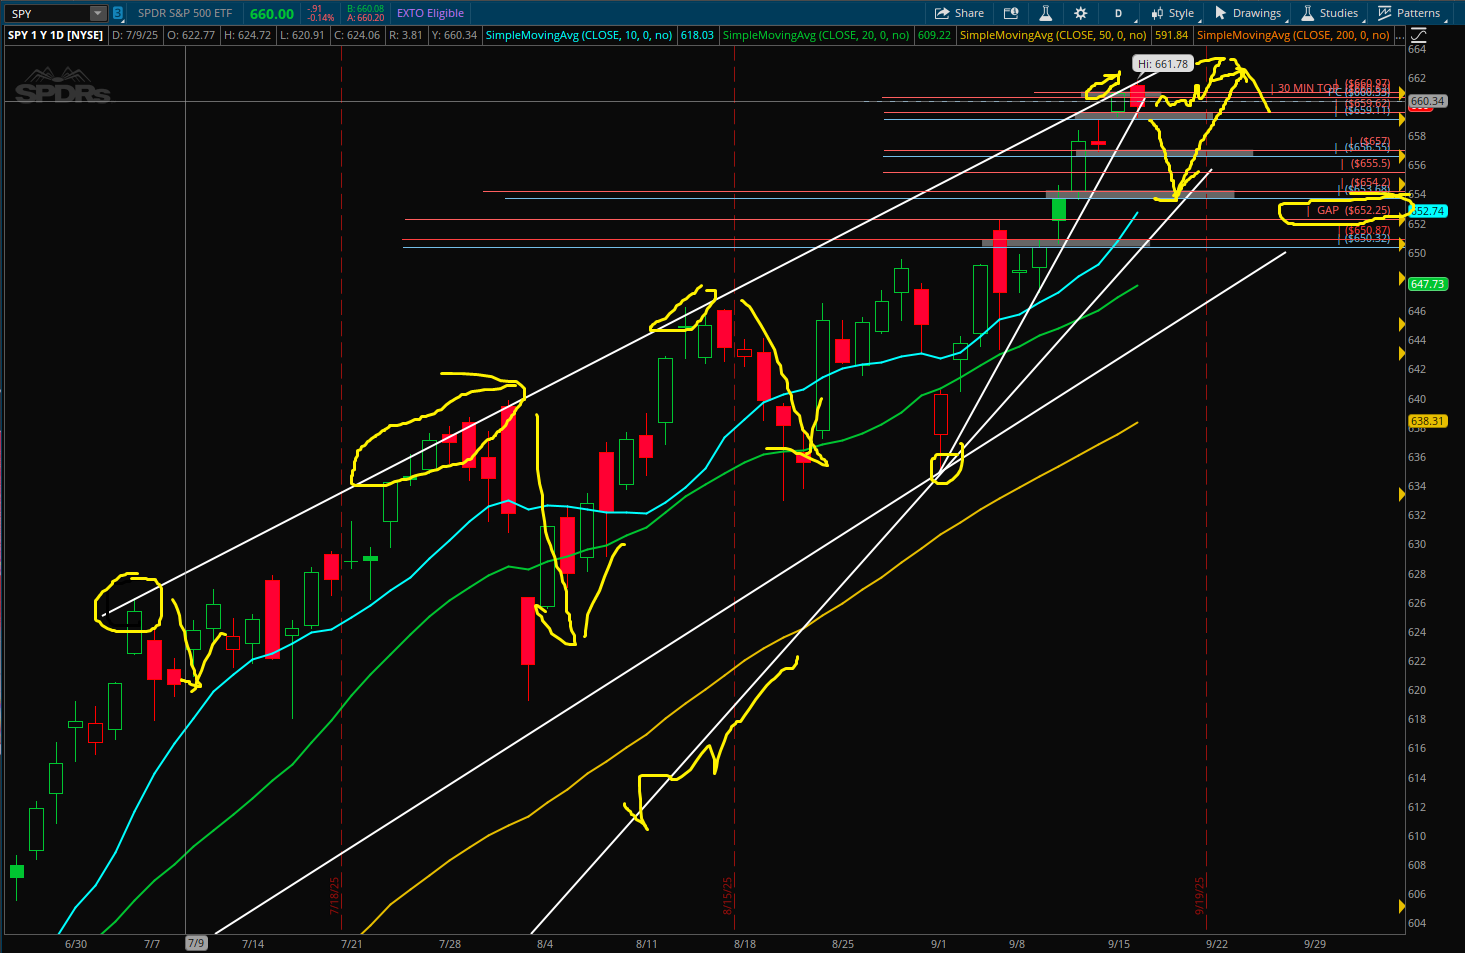
The S&P 500 has continued pushing to new all-time highs this week ahead of tomorrow’s FOMC meeting (9/17). In the background, however, there are signs of caution. The VIX has broken above its 50-day moving average, while BND (the Total Bond Market ETF) has pushed above its 200-week moving average.
The bullish price action in both bonds and the VIX could be a warning signal for equities. If the bears fail to defend the 659 support level, we may see a gap fill down toward 652, which also lines up with a potential retest of the 10-day moving average.
S&P 500 Chart Analysis
Disclaimer:
I am not a licensed financial advisor, and the information provided is for educational and informational purposes only. It should not be considered financial, investment, or tax advice. Please consult with a qualified financial professional before making any financial decisions.

Bond Market Analysis 9/11/2025
The Vanguard Total Market Index has broken above its 200-week moving average, while the BND Bond ETF is also showing signs of a breakout. Equity markets appear to be interpreting potential Fed rate cuts as a catalyst for stronger corporate profits, while the bond market seems to be pricing in a faster pace of cuts due to economic weakness.
This raises the key question: Who will be wrong?
So far, the Nasdaq, S&P 500, and Dow Jones Industrial Average have all reached new all-time highs this week, even as the bond market continues to rally. Historically, stocks and bonds have tended to move in opposite directions — when stocks decline, money often shifts into bonds, pushing bond prices higher, and when stocks rally, funds typically rotate out of bonds and into equities.
Disclaimer:
I am not a licensed financial advisor, and the information provided is for educational and informational purposes only. It should not be considered financial, investment, or tax advice. Please consult with a qualified financial professional before making any financial decisions.

SPY TRADING ANALYSIS 9-11-2025
The Dow Jones, Nasdaq and S&P 500 all made new all-time highs, it appears CPI/PPI data were well received this week by the market. I’m seeing a breakout of a trendline on the S&P 500 that may take us to the 660-area target. We may back test the breakout around the 655 area before continuation.
S&P 500 Trading Analysis

4hr S&P 500 Chart
Disclaimer:
I am not a licensed financial advisor, and the information provided is for educational and informational purposes only. It should not be considered financial, investment, or tax advice. Please consult with a qualified financial professional before making any financial decisions.

Six Major Changes to Higher Education Funding Under OBBBA
The new law reshapes how families, students, and even employers approach education funding. Here are six of the most significant changes:
1. Expanded Uses for 529 Plans
The definition of qualified education expenses is broadening. Families can now use 529 funds for:
Homeschooling supplies
Certain technology expenses
Test fees
Other non-tuition costs
In addition, the annual withdrawal limit for K–12 expenses will permanently increase from $10,000 to $20,000 in 2026.
A reminder: 529 plans are tax-advantaged accounts where contributions grow tax-deferred and qualified withdrawals are tax-free.
2. New Limits on Federal Student Loans
OBBBA eliminates the Graduate PLUS Loan program (effective July 1, 2026 for new borrowers) and introduces tighter borrowing caps:
Graduate Students: $20,500 annually; $100,000 lifetime.
Professional Degree Students (e.g., law, medicine): $50,000 annually; $200,000 lifetime.
Parent PLUS Loans: $20,000 annually per dependent; $65,000 lifetime.
Overall Lifetime Federal Loan Cap (excluding Parent PLUS): Roughly $257,500.
Existing Graduate PLUS borrowers may receive limited grandfathering.

3. Pell Grant Eligibility Changes
Starting July 1, 2026:
Pell Grants will cover job training and certificate programs, expanding access for vocational students.
Students with full-ride scholarships will no longer qualify for Pell, potentially limiting financial flexibility for some high-achieving, low-income students.
4. Employer Education Contributions Made Permanent
Employers can permanently provide up to $5,250 annually, tax-free, toward an employee’s education expenses or student loan repayments. Beginning in 2026, this limit will be indexed to inflation.
5. ABLE Account Enhancements Made Permanent
ABLE accounts (for individuals with disabilities) will permanently include:
Higher annual contribution limits for working beneficiaries without workplace retirement plans.
A nonrefundable Saver’s Credit of up to $2,100.
6. Creation of “Trump Accounts”
A new tax-advantaged investment account, similar to a traditional IRA, will be available for children. Key features:
Parents can contribute on behalf of their child.
Withdrawals allowed beginning at age 18.
Funds may be used penalty-free for qualified higher education expenses (among other approved uses).

SPY Trading Analysis - 9/10/2025
The S&P 500 gapped higher at the open, following yesterday’s breakout and a stronger-than-expected PPI report released at 8:30 a.m. This bullish momentum carried the index to new all-time highs before sellers stepped in, driving prices lower and breaking through both the 652 support level and the uptrend line.
However, the market managed to stabilize and recover some of its losses into the close. Looking ahead, all eyes will be on tomorrow’s CPI data, which could set the tone for the next move. The key question is whether the bulls can regain control and push the index decisively above the 653 resistance level.
S&P 500 Price Action Analysis
Disclaimer:
I am not a licensed financial advisor, and the information provided is for educational and informational purposes only. It should not be considered financial, investment, or tax advice. Please consult with a qualified financial professional before making any financial decisions.

S&P 500 Trading Analysis
Gold, Bitcoin, the VIX, and Bonds have all been on the decline this week, which may signal a risk-on environment—a positive backdrop for equity buyers. The S&P 500 has been consolidating in a range between 647 and 650, but today’s session closed with a slight breakout, suggesting the potential for a push toward 651 and all-time highs. The repeated tests of the 647 level also form a triple bottom, reinforcing bullish sentiment. Attention now shifts to the upcoming PPI and CPI releases, which could play a pivotal role in shaping price action for the rest of the week.
S&P 500 Price Action Analysis on 9/9/2025
Disclaimer:
I am not a licensed financial advisor, and the information provided is for educational and informational purposes only. It should not be considered financial, investment, or tax advice. Please consult with a qualified financial professional before making any financial decisions.

BITCOIN ANALYSIS - $125,200
Bitcoin appears to have formed a potential short-term top near the $125,200 level and is currently consolidating between the 10-week and 20-week moving averages. This range is critical for determining the next directional move. A decisive breakout above the 10-week moving average would indicate renewed bullish momentum, potentially paving the way for a retest of its all-time highs and possibly establishing a higher resistance zone. Conversely, if Bitcoin fails to hold the $109,000 support level, which aligns with the lower end of the current consolidation range, it could trigger a deeper correction toward the psychological $100,000 mark. Traders should monitor volume trends and momentum indicators such as RSI and MACD to confirm any breakout or breakdown scenario
Bitcoin appears to have formed a potential short-term top near the $125,200 level and is currently consolidating between the 10-week and 20-week moving averages. This range is critical for determining the next directional move. A decisive breakout above the 10-week moving average would indicate renewed bullish momentum, potentially paving the way for a retest of its all-time highs and possibly establishing a higher resistance zone. Conversely, if Bitcoin fails to hold the $109,000 support level, which aligns with the lower end of the current consolidation range, it could trigger a deeper correction toward the psychological $100,000 mark. Traders should monitor volume trends and momentum indicators such as RSI and MACD to confirm any breakout or breakdown scenario.
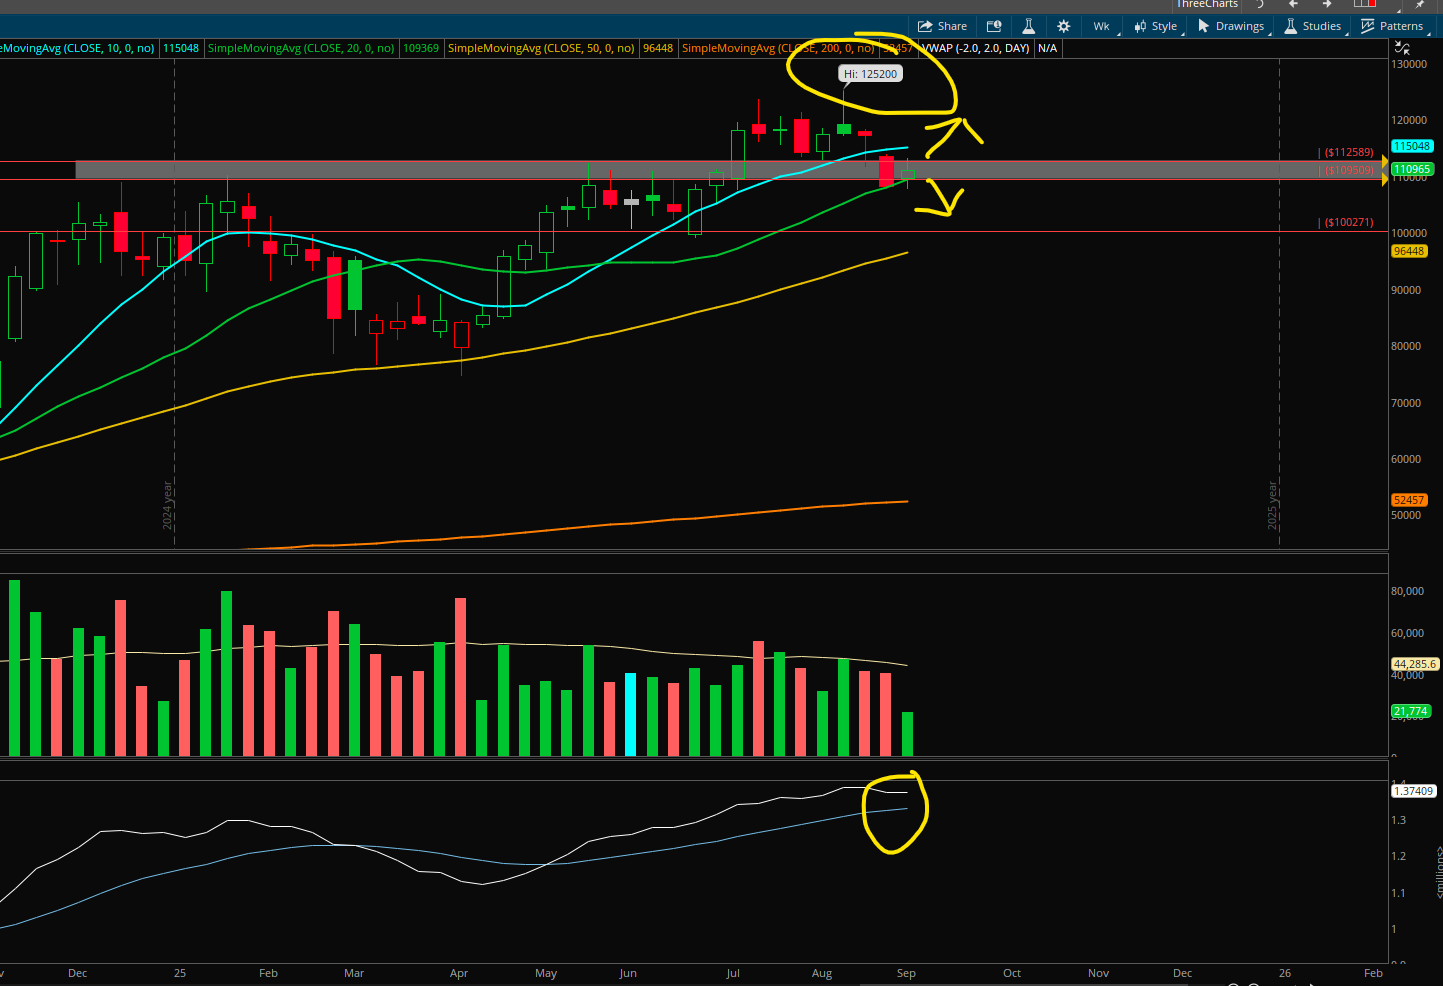
This is a chart of Bitcoin
Disclaimer:
I am not a licensed financial advisor, and the information provided is for educational and informational purposes only. It should not be considered financial, investment, or tax advice. Please consult with a qualified financial professional before making any financial decisions.

9-4-2025 S&P 500 Trading Session - $126
9/4/2025 Trading Session on the S&P 500.
In today’s trading the session the S&P 500 filled the gap down and so I lost $34 in 646 calls. I quickly switched to 643 0DTE puts and made $27 on the downward movement. At around 10am the market rebounded breaking 646 resistance and closing the gap above at an attempt to hit all-time highs. I’m swinging a 648 call that is currently $133 in profit. I’m expecting the S&P 500 to hit all times on 9/5/2025.


Disclaimer:
I am not a licensed financial advisor, and the information provided is for educational and informational purposes only. It should not be considered financial, investment, or tax advice. Please consult with a qualified financial professional before making any financial decisions.

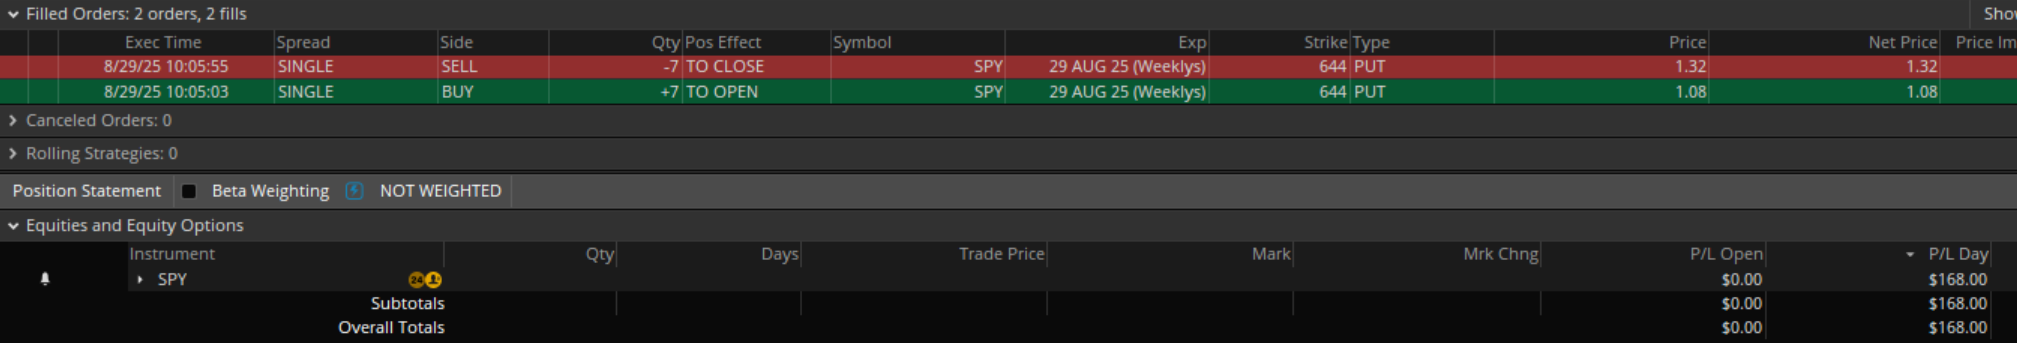
$168 Gain in 60 Seconds | Options Trading
Good morning,
This morning, I saw the S&P 500 gap down and break support at 646. I acted fast and bought seven 644 puts at $108 each and sold them less than a minute later for $132 each. That’s a $168 profit in under 60 seconds.
Sounds exciting, right? Many people I meet want this kind of quick win. But here’s the truth: trading is not investing. It’s high risk, and for every win like this, I’ve experienced plenty of losses.
Strong financial planning isn’t built on short-term speculation. It’s about long-term investing, disciplined strategies, and risk management that protect and grow your wealth. Quick profits can happen, but true financial success comes from a solid plan.
Which side do you want to build your future on—short-term luck or long-term strategy?
Disclaimer:
I am not a licensed financial advisor, and the information provided is for educational and informational purposes only. It should not be considered financial, investment, or tax advice. Please consult with a qualified financial professional before making any financial decisions.