2026 Market Snapshot
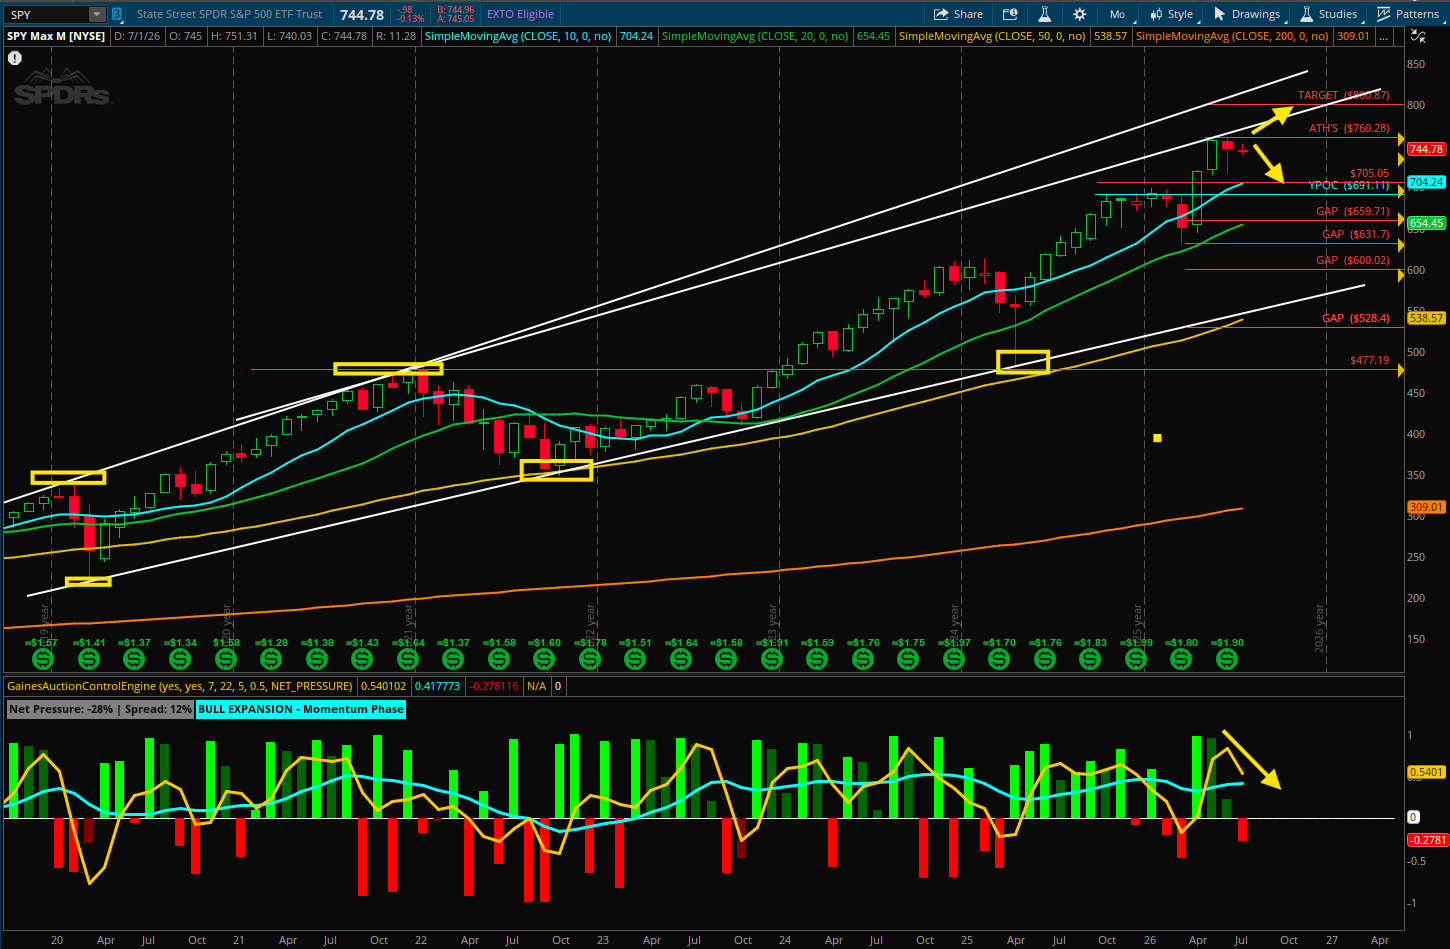
Based on the monthly chart, SPY continues to trade within a well-defined long-term ascending channel, reflecting a persistent bullish trend. Price is currently testing the all-time highs near 760, and a decisive breakout above this level could open the door for a measured move toward the upper boundary of the channel near 800. As long as SPY remains above key support levels and the ascending channel remains intact, the primary trend continues to favor higher prices.
From the perspective of the Gaines Auction Control Engine (GACE), the market is currently in a Bull Expansion phase. Net Pressure remains positive, indicating buyers continue to control the auction, while the Fast Trend has accelerated above the Slow Trend following the recent pullback, signaling that buying conviction is strengthening faster than the underlying trend. Importantly, the Slow Trend remained above zero throughout the correction, suggesting sellers never gained meaningful control of the auction. This implies the pullback was likely a period of profit-taking rather than a structural shift in market direction. Taken together, the price action and GACE indicate a healthy bullish continuation, with demand reasserting itself and buyers remaining the dominant force driving price discovery.
Investment Disclaimer: The information provided is for educational and informational purposes only. It should not be considered financial, investment, or tax advice. Please consult with a licensed investment advisor before making any investment decisions.