July 2026 Market & Economic Pulse: A Mid-Year Snapshot
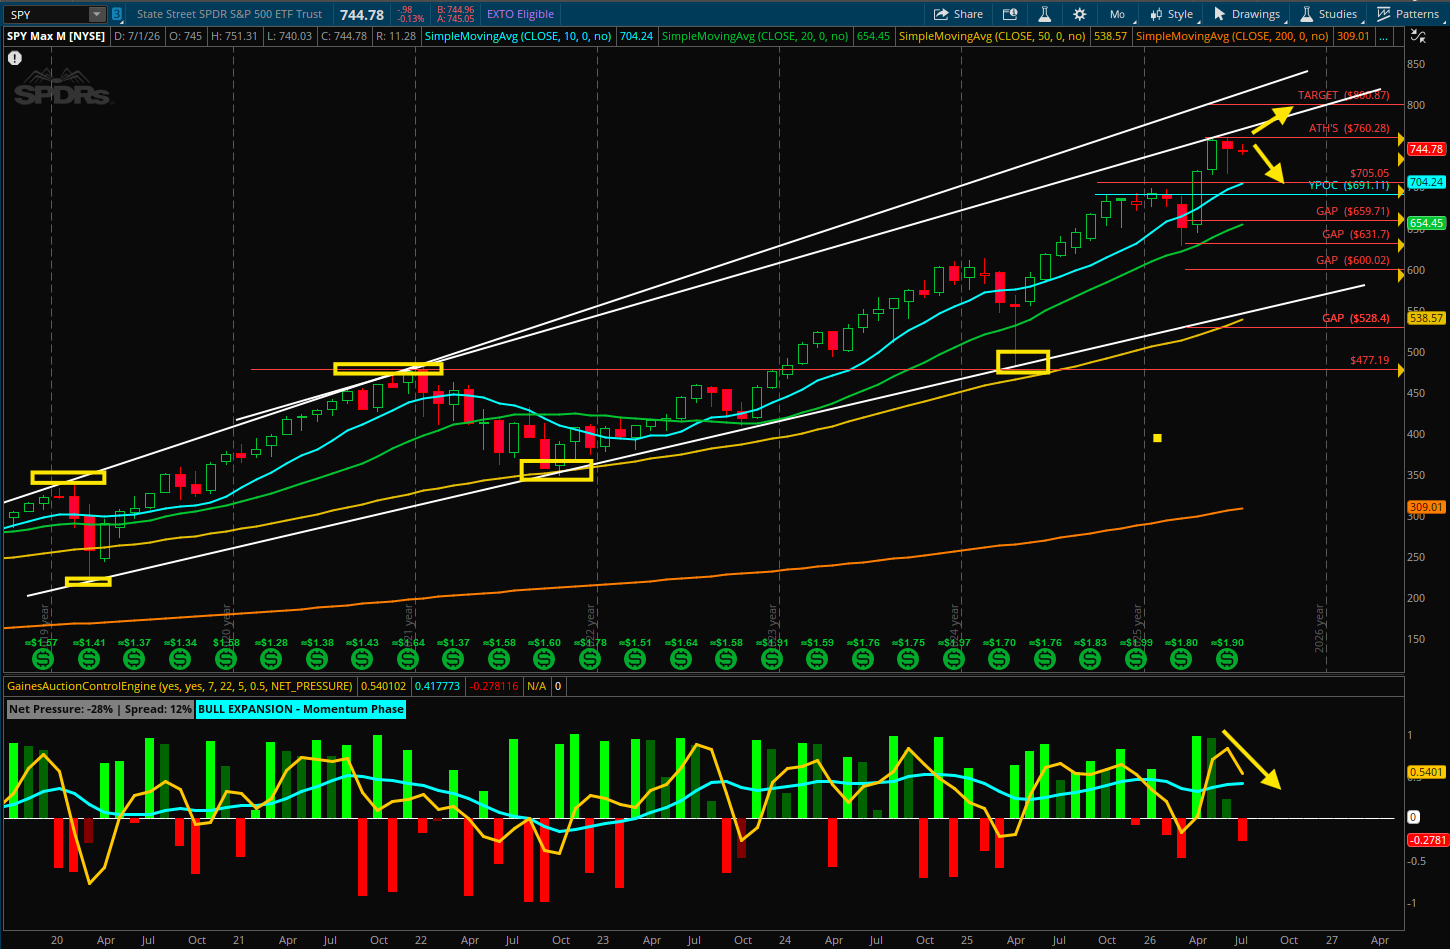
S&P 500 - Monthly Chart
Executive Market Summary
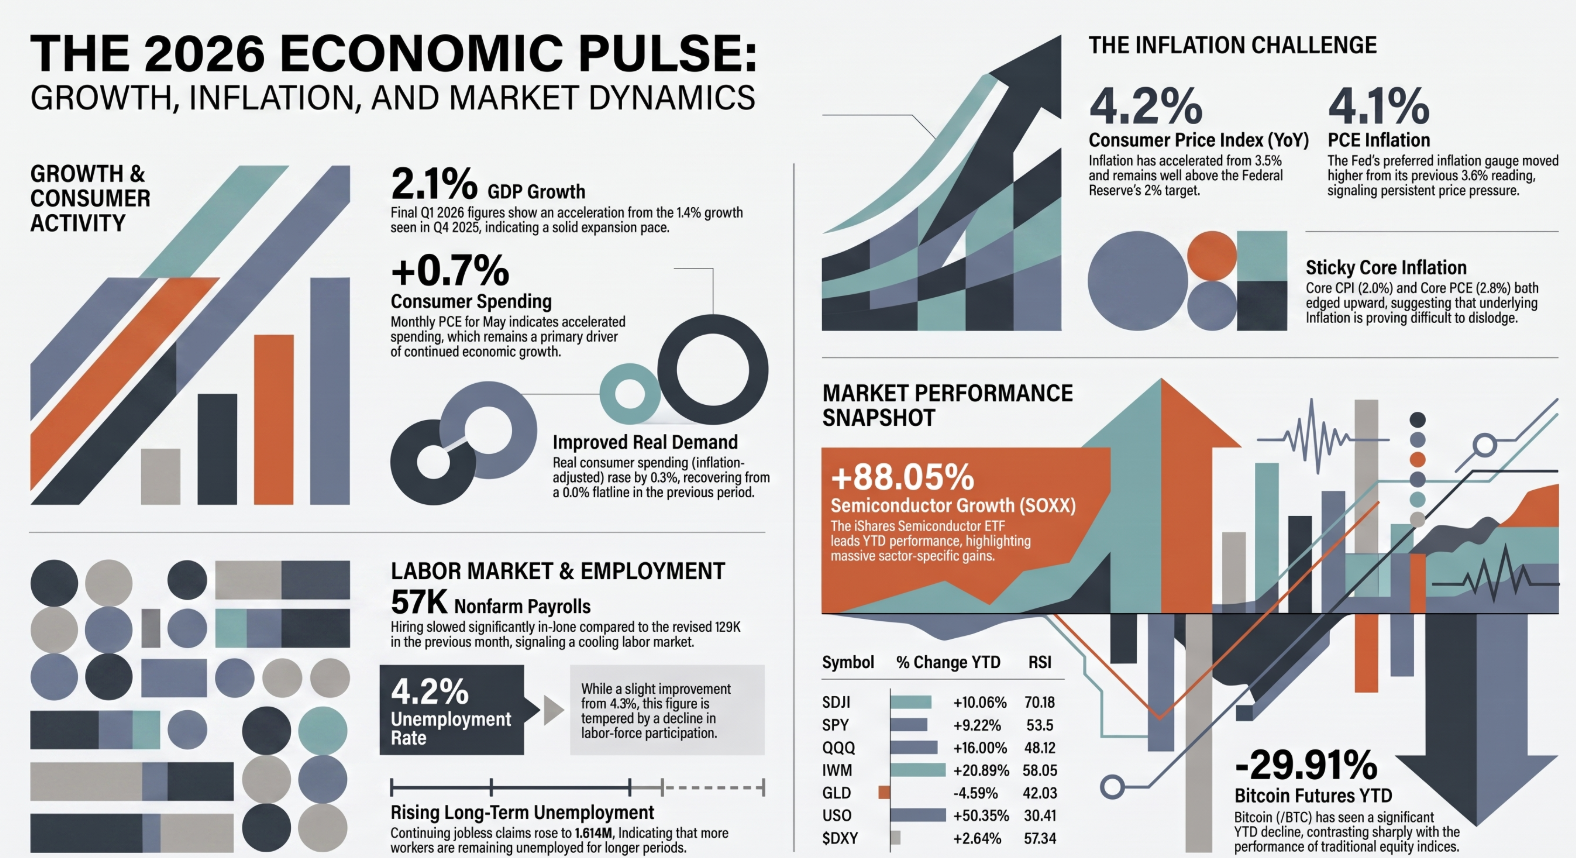
As of July 2, 2026, the U.S. financial markets exhibit a narrative of resilience underscored by significant sector-specific volatility. Year-to-date (YTD) performance for the broader benchmarks remains robust, with the Dow Jones Industrial Average ($DJI) returning +10.06% and the tech-heavy Invesco QQQ posting a +16.00% gain. However, a stark divergence is visible within the technology landscape; the semiconductor sector (SOXX) has achieved a meteoric +88.05% YTD surge, yet it faces immediate-term headwinds, evidenced by a sharp -5.20% daily pullback. This mid-year junction reveals an economy grappling with "sticky" inflation even as the dominant "Magnificent 7" stocks continue to anchor market capitalization through high-growth AI and cloud narratives.
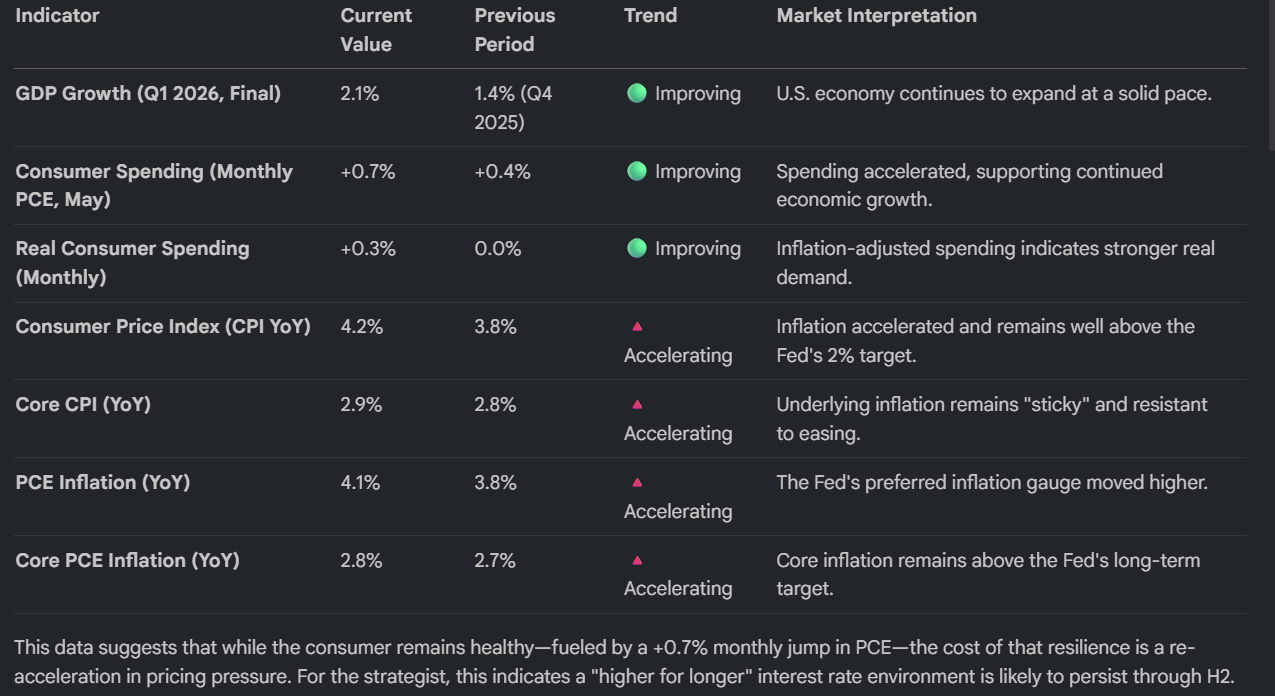
The Macroeconomic Landscape: Growth vs. Inflation
The first half of 2026 has been defined by a fundamental "tug-of-war." Solid top-line growth and accelerating consumer demand are acting as a floor for the economy, while persistent inflationary pressure prevents the Federal Reserve from reaching its 2% target.
Labor Market Trends: Cooling Signals
While headline unemployment remains low, the internal dynamics of the labor market suggest a transition toward "stagnant re-employment."
Labor Force Dynamics
Deceleration in Hiring: June Nonfarm Payrolls arrived at a muted 57K, a significant drop from the revised previous figure of 129K, signaling a clear cooling in employer appetite.
Nuanced Unemployment: The Unemployment Rate sits at 4.2% (a slight improvement from 4.3%), but this headline figure is dampened by a noted decline in labor-force participation.
Stagnant Re-employment: While layoffs remain historically low (Initial Jobless Claims at 215K), Continuing Jobless Claims have climbed to 1.814M. This delta suggests that while workers aren't being terminated in mass, those currently unemployed are finding it increasingly difficult to secure new roles.
Wage Stabilization: Average Hourly Earnings remain steady at 0.3% MoM and 3.5% YoY, providing a moderate but consistent floor for inflation.
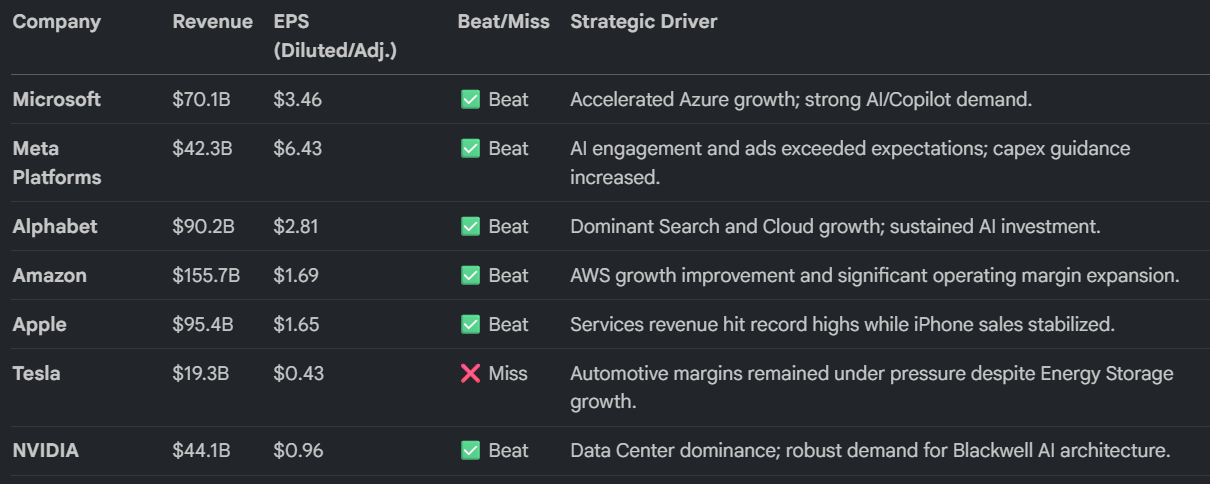
Corporate Earnings Spotlight: The Magnificent 7 (Q1 2026)
The Q1 2026 earnings season reinforced the dominance of AI infrastructure and cloud services. The robust Blackwell AI demand and Azure growth recorded here are the primary fundamental drivers behind the massive +88.05% YTD gain in the semiconductor sector.
Asset Class & Sector Performance Analysis
Market performance through early July illustrates a stark decoupling between traditional energy, small-caps, and the digital asset space.
Market Heatmap (YTD Performance through July 2, 2026)
Commodities:United States Oil (USO) has been the standout performer with a +50.35% YTD surge, contrasted by a -4.59% decline in Gold (GLD) as the "inflation hedge" trade loses luster to cash.
Fixed Income & Currency: A strengthening US Dollar Index ($DXY) at +2.64% YTD continues to weigh on international returns, while the Vanguard Total Bond Market (BND) has struggled, posting a -1.30% YTD return as yields remain elevated.
Equities & Crypto: Risk-on sentiment has favored small-caps, with the Russell 2000 (IWM) gaining +20.89% YTD. Conversely, Bitcoin Futures (/BTC) have faced a "crypto winter" correction, down -29.91% YTD.
Sentiment & Volatility: Current market positioning appears highly optimistic, perhaps even complacent. The Put/Call ratio ($PCALL) stands at 0.685, indicating a bullish-leaning market that may be over-extended. The VIX remains contained at 16.150, despite recent daily volatility in tech.
Conclusion: The Road Ahead for H2 2026
The U.S. economy enters the second half of 2026 on solid footing regarding GDP and consumer demand, yet the path forward is narrow. The primary risk remains the "sticky" 4.2% CPI inflation, which threatens to keep borrowing costs high and further cool the labor market. While the concentrated Roundhill Magnificent Seven ETF (MAGS) has actually dipped slightly (-1.30% YTD), the broader market participation via the SPY (+9.22%) and ITOT (+10.14%) indicates a resilient, diversified rally. Investors should remain wary of the stagnant re-employment trend and the high level of complacency suggested by the current Put/Call ratio as we navigate the remainder of the year.